14
2. Apply an adequate amount of low viscosity gel or water to the scan
surface. If water is used, ll the scanning well slowly to avoid introduction
of air bubbles.
3. Adjust the instrument settings (TGC, output, etc.) to establish baseline
values for "normal" scanning. If the bottom of the phantom is
visualized, adjust the gain settings until the image goes entirely black.
Record these settings on the quality assurance record. These setting
should be used for subsequent testing.
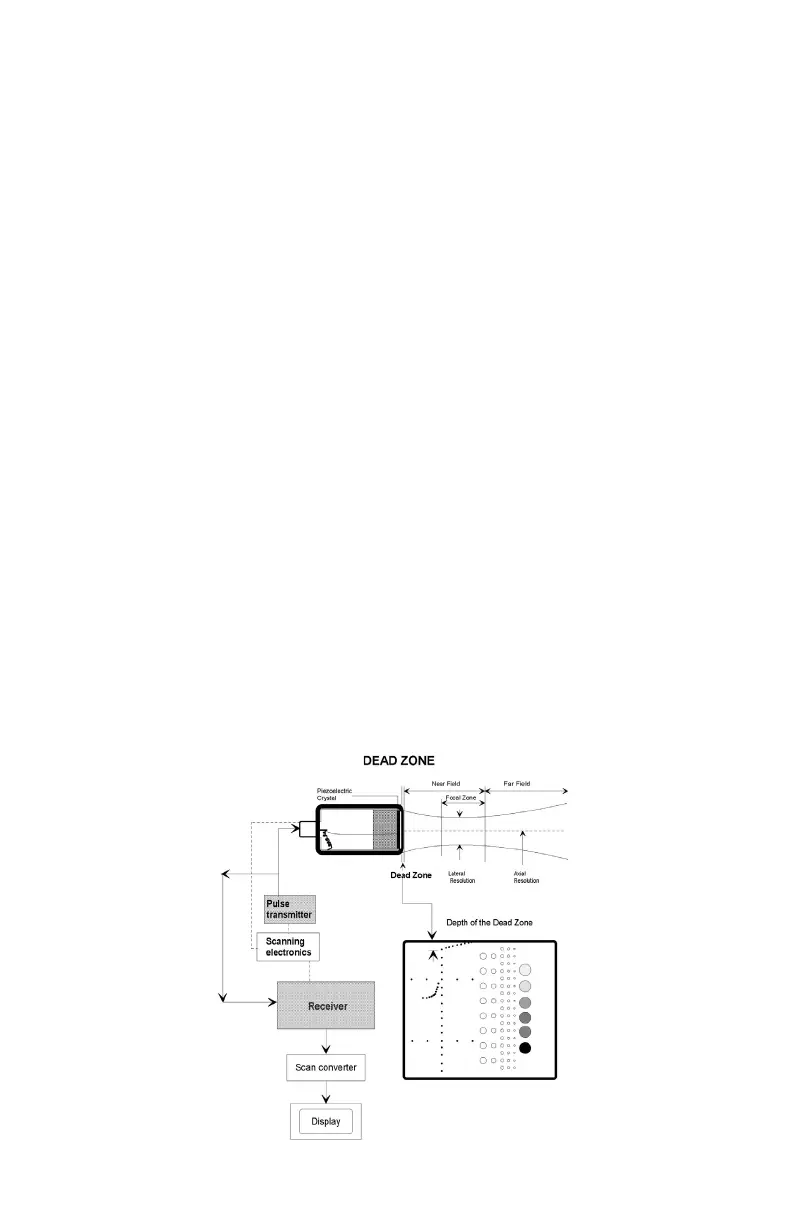
4. Scan the phantom until the dead zone target group is clearly displayed.
Freeze this image.
5. This group is composed of 9 line targets. The rst target is positioned
2 mm below the scan surface. Subsequent targets are spaced 1 mm
apart, to a depth of 10 mm.
6. Using the electronic calipers, measure the distance between the rst
target imaged and the echo produced by the scan surface. The resulting
value will be the depth of the dead zone.
7. Document the depth measurement on the quality assurance record.
Results:
If the depth of the dead zone is greater than 10.0 mm, corrective action should be
considered by the individual Ultrasound Department.