59
TECHNICAL
& CARE
Table 6 — System repeatability results for CONTOUR NEXT LINK 2.4 meter using
C
ONTOUR NEXT test strips
Mean,
mg/dL
Pooled Standard
Deviation
Coefficient of Variation,
%
39.6 0.8 2.0
80.7 1.0 1.3
122.3 1.6 1.3
204.8 2.8 1.4
330.4 4.5 1.4
Intermediate precision (which includes variability across multiple days) was evaluated using
2 control solutions. With each of 3 lots of C
ONTOUR NEXT test strips, each control was
tested once on each of 10 instruments on 10 separate days for a total of 300 readings.
Table 7 — System intermediate precision results for CONTOUR NEXT LINK 2.4 meter
using C
ONTOUR NEXT test strips
Control
Level
Mean,
mg/dL
Standard Deviation,
mg/dL
Coefficient of Variation,
%
Level 1
46.3 0.7 1.6
Level 2
130.3 2.1 1.6
Precision
Precision
A repeatability study was conducted with the CONTOUR
®
NEXT LINK 2.4 blood glucose
monitoring system using 5 venous whole blood specimens with glucose levels from 40 to
334 mg/dL. Multiple replicates (n=300) were tested using multiple C
ONTOUR
®
NEXT LINK 2.4
blood glucose meters and 3 lots of C
ONTOUR
®
NEXT blood glucose test strips. The following
precision results were obtained.
85587269_CntrNextLINK_2_4_UG_EN_FpBp_v4.indd 59 11/18/16 9:03 AM
TECHNICAL
& CARE
58
®
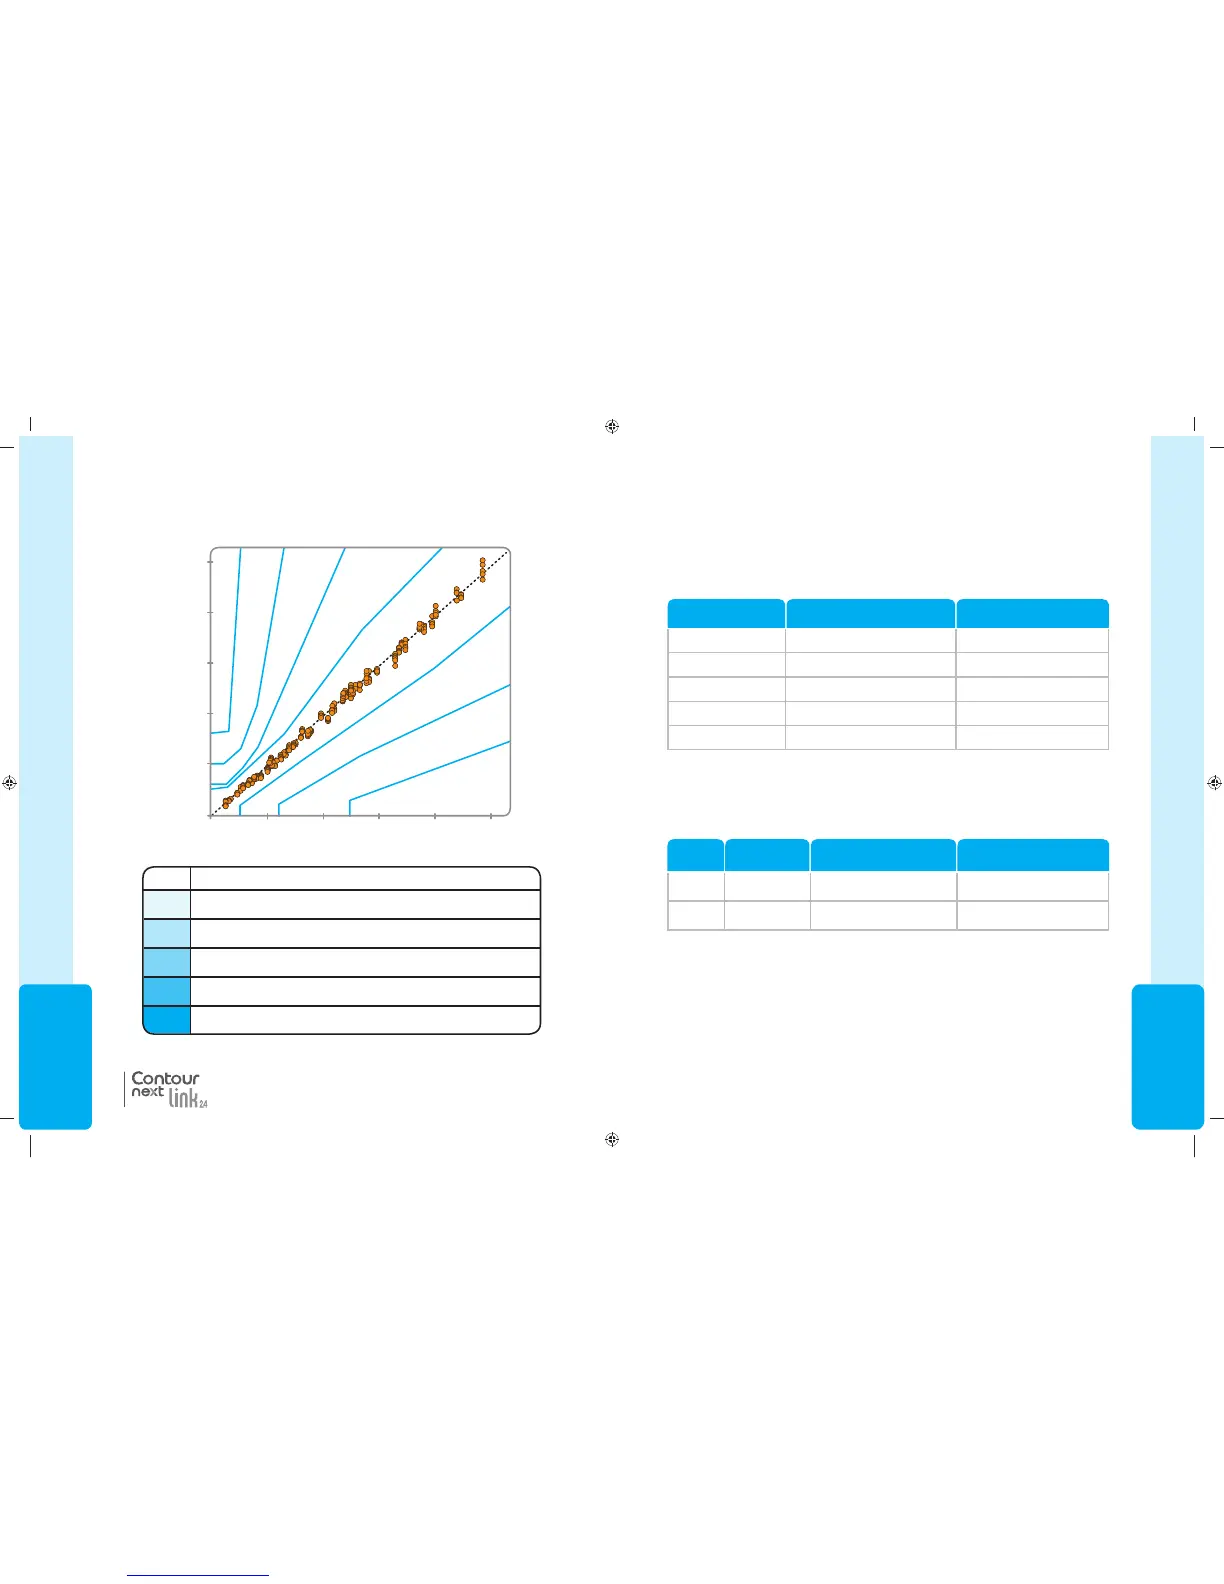
Accuracy
Figure 1 — 100% of results are within Zone A of the Consensus Error Grid for
C
ONTOUR NEXT LINK 2.4.
9
CONTOUR
®
NEXT LINK 2.4 (mg/dL)
YSI (mg/dL)
100
200
300
400
500
100 200 300 400 500
E
D
C
B
A
A
B
C
D
0
0
System Accuracy (Difference) Plot, CONTOUR
®
NEXT LINK 2.4 with
Three C
ONTOUR
®
NEXT Reagent Lots
ZONE
DEGREE OF RISK
A
No effect on clinical action
B
Altered clinical action with little or no effect on clinical outcome
C
Altered clinical action—likely to affect clinical outcome
D
Altered clinical action with possibly significant medical risk
E
Altered clinical action with possibly dangerous consequences
85587269_CntrNextLINK_2_4_UG_EN_FpBp_v4.indd 58 11/18/16 9:03 AM
59
TECHNICAL
& CARE
Table 6 — System repeatability results for CONTOUR NEXT LINK 2.4 meter using
C
ONTOUR NEXT test strips
Mean,
mg/dL
Pooled Standard
Deviation
Coefficient of Variation,
%
39.6 0.8 2.0
80.7 1.0 1.3
122.3 1.6 1.3
204.8 2.8 1.4
330.4 4.5 1.4
Intermediate precision (which includes variability across multiple days) was evaluated using
2 control solutions. With each of 3 lots of C
ONTOUR NEXT test strips, each control was
tested once on each of 10 instruments on 10 separate days for a total of 300 readings.
Table 7 — System intermediate precision results for CONTOUR NEXT LINK 2.4 meter
using C
ONTOUR NEXT test strips
Control
Level
Mean,
mg/dL
Standard Deviation,
mg/dL
Coefficient of Variation,
%
Level 1
46.3 0.7 1.6
Level 2
130.3 2.1 1.6
Precision
Precision
A repeatability study was conducted with the CONTOUR
®
NEXT LINK 2.4 blood glucose
monitoring system using 5 venous whole blood specimens with glucose levels from 40 to
334 mg/dL. Multiple replicates (n=300) were tested using multiple C
ONTOUR
®
NEXT LINK 2.4
blood glucose meters and 3 lots of C
ONTOUR
®
NEXT blood glucose test strips. The following
precision results were obtained.
85587269_CntrNextLINK_2_4_UG_EN_FpBp_v4.indd 59 11/18/16 9:03 AM
TECHNICAL
& CARE
58
®
Accuracy
Figure 1 — 100% of results are within Zone A of the Consensus Error Grid for
C
ONTOUR NEXT LINK 2.4.
9
CONTOUR
®
NEXT LINK 2.4 (mg/dL)
YSI (mg/dL)
100
200
300
400
500
100 200 300 400 500
E
D
C
B
A
A
B
C
D
0
0
System Accuracy (Difference) Plot, CONTOUR
®
NEXT LINK 2.4 with
Three C
ONTOUR
®
NEXT Reagent Lots
ZONE
DEGREE OF RISK
A
No effect on clinical action
B
Altered clinical action with little or no effect on clinical outcome
C
Altered clinical action—likely to affect clinical outcome
D
Altered clinical action with possibly significant medical risk
E
Altered clinical action with possibly dangerous consequences
85587269_CntrNextLINK_2_4_UG_EN_FpBp_v4.indd 58 11/18/16 9:03 AM
85587269_CntrNextLINK_2_4_UG_EN_FpBp_v5_UnMaskedPlaced.pdf:62