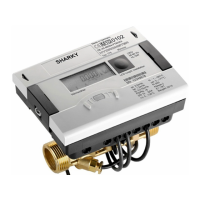
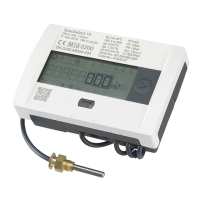
Instruction SONOMETER™ 1100
DEN-SMT/PL VI.SH.K1.02 Danfoss District Enrgy
8
9.0 Display
To show the data generated by the calculator in the display, various win-
dows are provided as loop functions that can be called up in succession to
display the system information associated with each window (e.g. energy
amounts, water volume, running days, water amounts, current tempera-
tures). The energy meter has 6 dierent display loops.
The various display windows comprise up to several displays that
change at intervals of 2 – 4 s. The loops in the display are numbered 1,
2, ... and 6 to help the user nd his way around quickly. The main loop
is programmed with the current data as default setting, e.g. for energy,
volume and ow rate.
Informative Displays (Standard)
Loop Sequence Window 1 Window 2 Window 3
“1”
Main loop
1.1 Accumulated energy
1.2 Volume
1.3 Accumulated energy (cooling)
(Sequence will be shown only
in a heat meter with cooling tariff)
1.4 Flow
1.5 Power
1.6 Forward ⁄ return temperature
1.7 Temperature dierence
1.8 Operating days Error hours
1.9 Error status
1.1 Display test
Loop Sequence Window 1 Window 2 Window 3
“2”
Accounting
date loop
2.1 Accounting date 1 Accounting date 1 energy ‚Accd 1A’
2.2 ‚Accd 1’ Future accounting date 1
2.3 Accounting date 1 previous year
Accounting date 1
previous year energy
‚Accd 1L’
2.4 Accounting date 2 Accounting date 2 energy ‚Accd 2A’
2.5 ‚Accd 2’ Future accounting date 2
2.6 Accounting date 2 previous year
Accounting date 2
previous year energy
‚Accd 2L’
...
2.14 Accounting date 2 previous year Pulse input 2 Pulse input volume 2
Loop Sequence Window 1 Window 2 Window 3
“3“
Info loop
3.1 Current date Current time
3.2 ,SEC_Adr' Secondary address
3.3 ,Pri_Adr 1' Primary address 1
3.4 ,Pri_Adr 2' Primary address 2
3.5 Installation position
3.6 ,Port 1’ No. of the mounted module at port 1
3.7 ,Port 2’ No. of the mounted module at port 2
3.8 Status integrated radio
(Sequence will be shown only in
meters with integrated radio)
3.9 software version Checksum
Loop Sequence Window 1 Window 2 Window 3
“4”
Pulse input
loop
4.1 ,In1' Accumulated value pulse input 1 ,PPI' pulse value 1
4.2 ,In2' Accumulated value pulse input 2 ,PPI' pulse value 2
Loop Sequence Window 1 Window 2 Window 3 Window 4 Window 5 Window 6
“5”
Tari loop
Only in a heat meter with cooling tariff.
Loop Sequence Window 1 Window 2 Window 3 Window 4 Window 5 Window 6
“6”
Monthly value
loop
6.1 ,LOG’ date last month energy volume max. flow rate max. power
6.2 ,LOG’ date month 1 energy volume max. flow rate max. power
6.3 ,LOG’ date month 2 energy volume max. flow rate max. power
... ...
6.24 ,LOG’ date month 23 energy volume max. flow rate max. power