16
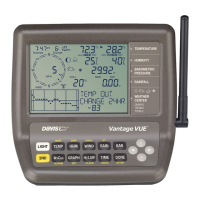
To view Graph Mode:
1. Press a variable and then press GRAPH. The graph and the minimum
and maximum readings for the selected weather variable display. The
reading in the weather variable field corresponds to the flashing dot on the
graph. Press the key or key combination for any variable to view that
variable in Graph Mode.
2. Press < or > to move right or left on the graph. The selected data point
flashes, and the reading in the weather variable field changes. The time
and/or date will also change as you move backward and forward.
3. Press + or - to change the graph to the highs and lows for the current and
last 25 hours, days, months, or years. Press HI/LOW to switch between
highs and lows. The time and date change as you move backward and
forward in time. (NOTE: Not all highs and lows are available for all
weather variables. See Vantage Vue Console Manual for details.) Press
DONE to exit the Graph Mode.
Graphs
 Loading...