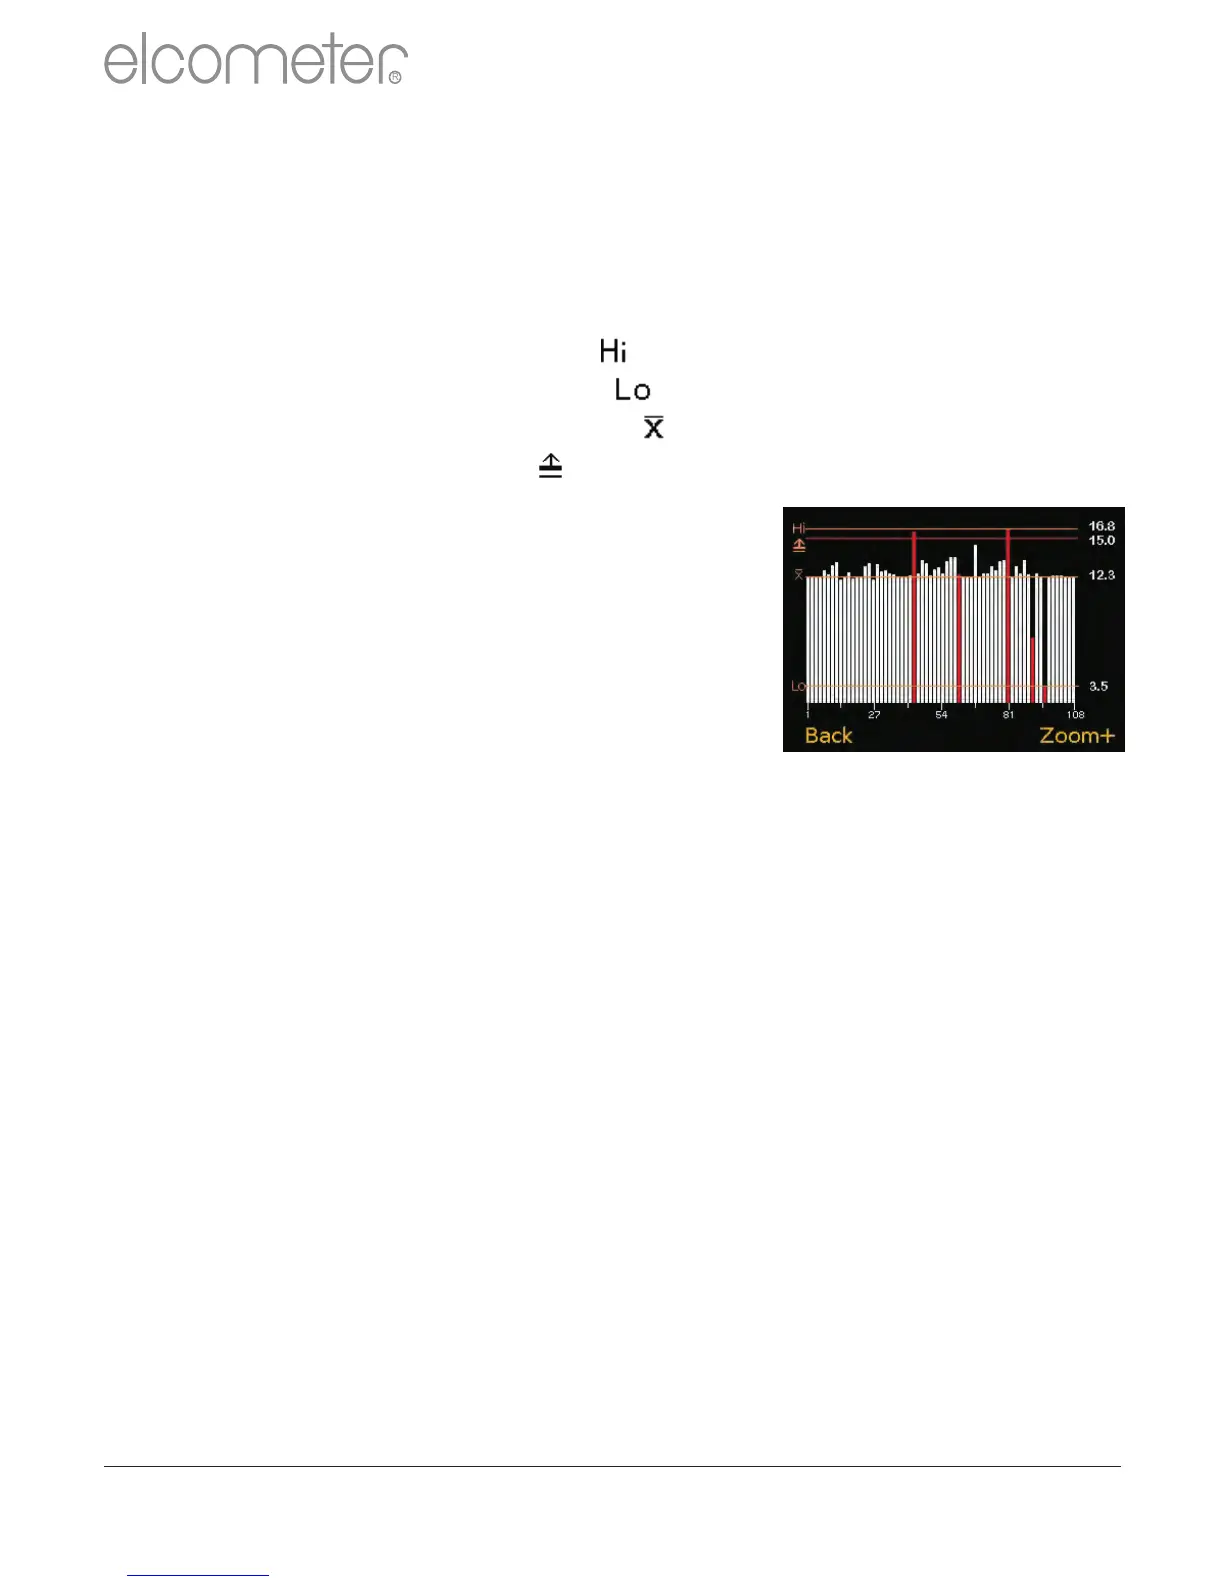
Batch Readings Graph (T)
By selecting Batch/Review Batch/Batch Graph the user can review
all readings in the selected batch as a graph.
Up to four horizontal axes can be displayed representing different
values / statistics as follows:
Highest reading in the batch “ ”
Lowest reading in the batch “ ” (for batches of more than one reading)
Mean of readings in the batch “ ” (for batches of more than one reading)
High limit for the batch “ ”(when enabled)
The readings are displayed as white or red
vertical bars; white if a reading is below the limit
(or if no limit have been set), and red if above
the limit.
If there are more readings in the batch than can
be displayed clearly on a single screen,
multiple readings will be combined into one
bar. Should a single reading within the
‘combined bar’ be above the upper limit, the
whole bar will be red.
Pressing the Zoom+ softkey, allows each individual reading to be
displayed, thereby showing the individual readings above the above
limit.
When zoomed in, the graph will always display the first 25 readings.
Pressing the ç softkey will display the last 25 readings taken.
Subsequent presses of the ç softkey will scroll backwards. Pressing
the è softkey will scroll forwards through the readings, 25 readings at
a time.
Pressing the Zoom- softkey returns to the original overview graph of
all readings in the batch.
To return the gauge to the Batch Review menu, press the Back
softkey.
R
en
www.elcometer.com
27