ER5000 —
131
The ERTune™ Program: Basic Features
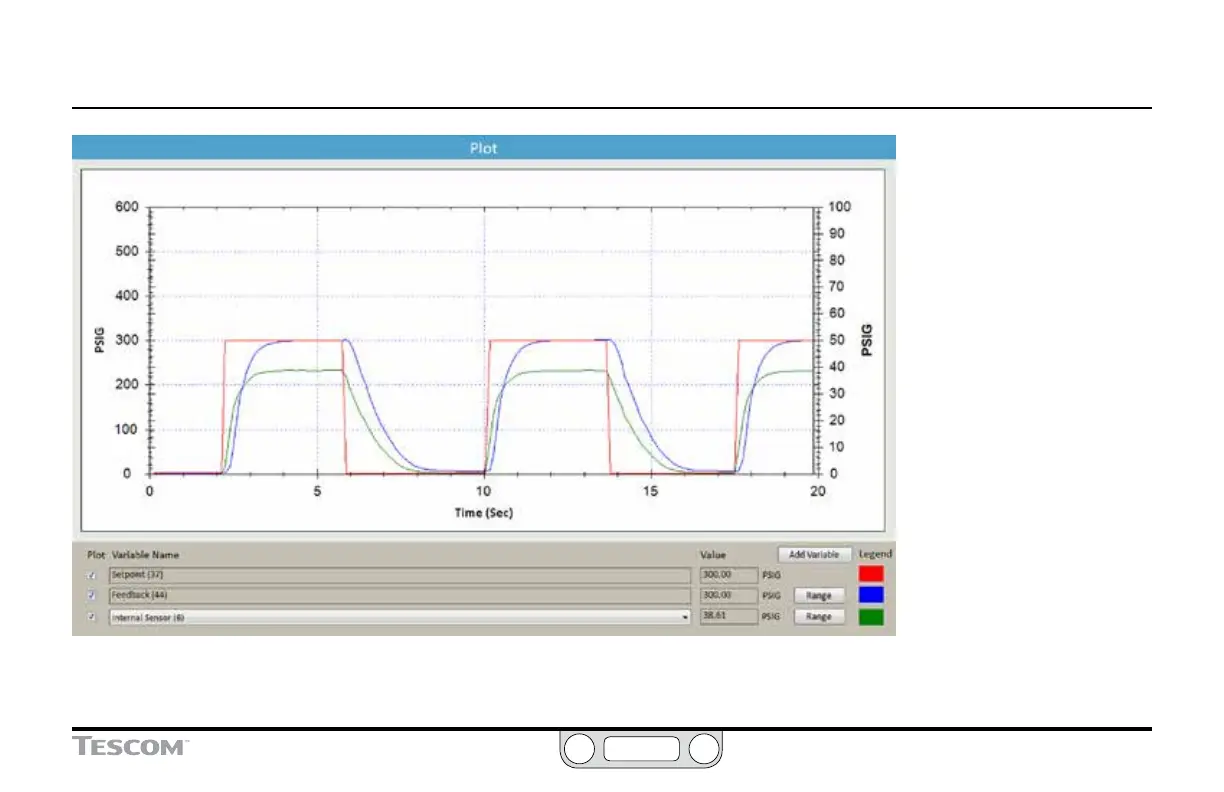
Figure 48: The Active Plot Screen Display
Figure 48 shows all the
elements of the active Plot
Screen display as the ER5000
responds to step changes in
setpoint (red line).
The response is tracked through
the feedback (blue line).
The main (left) vertical axis
and the horizontal axis have
been customized using the
commands in The Plot Screen
Menus — The Main Axis Menu.
In this application, the
ER5000’s internal sensor is
also being tracked directly
as an Added Variable (green
line), which has been added to
the Plot Screen using The Plot
Screen Variable Controls.
The Secondary Axis displays
the range for the internal
sensor. The green line tracks
to this range.
 Loading...