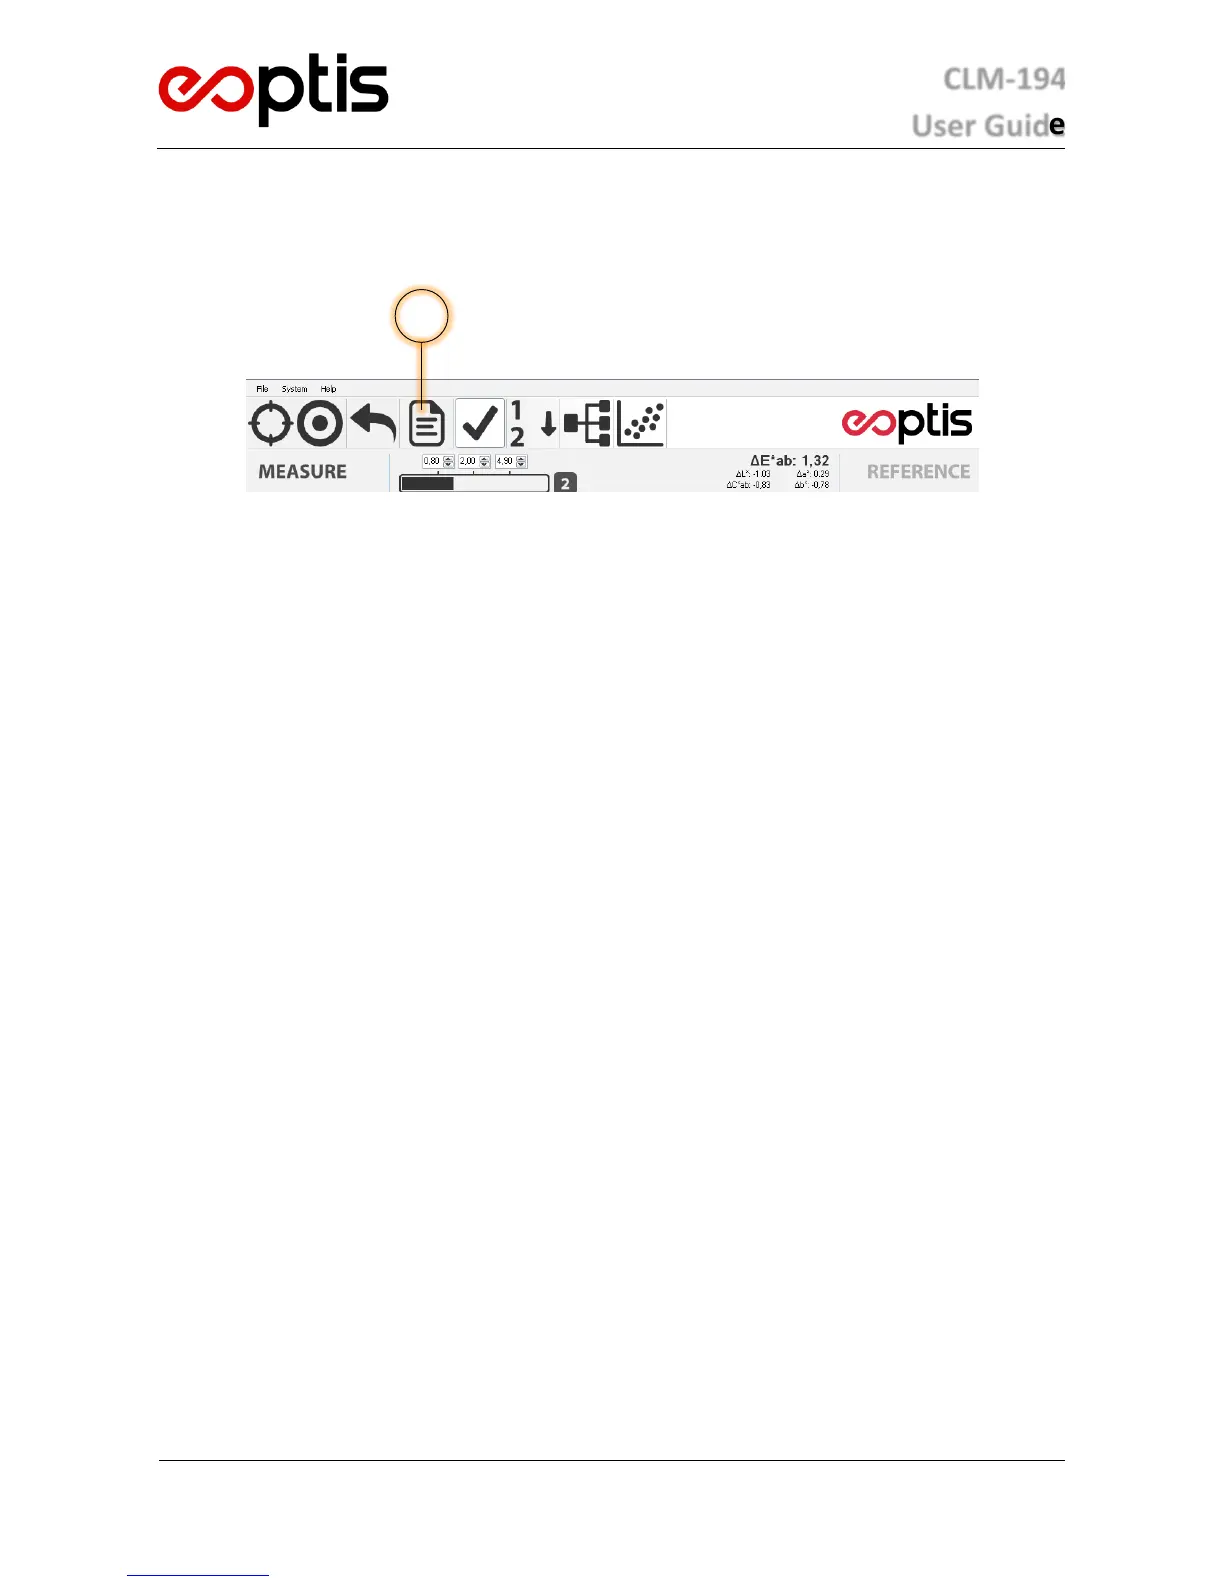
5.7 REPORT GENERATION
The software can generate a report of the data in the Measure list by clicking the Save Report button or accessing
The PDF report shows the name and the actual colour of each measured sample, as well as the CIELAB coordinates
and other relevant information related to the selected analysis feature. All data are sorted by groups. If a note is
added to the colour, it will also be printed on the PDF. A user logo will be printed at the top of the report. To
customisare executable folder with an image file with
the same name and format; this file will be automatically loaded during report generation. The recommended size is
277x165 (other sizes will be rescaled).
The XML format is meant to be used for off-line analysis purposes. The file can be opened with a spreadsheet program
(such as , so the included data can be used to analyse the acquired data. For each entry,
the report displays the colour name, the CIELAB coordinates, the group, any note added by the user and date/time
information and other relevant information related to the selected analysis feature.
5.8 USER CALIBRATION
Each colorimeter is supplied with its own white reference standard, necessary to perform the user calibration. The
standard is manufactured from highly stable materials and labelled with a unique serial number. Ensure that the
colorimeter is used with its matching white reference standard and that the serial numbers match, otherwise
calibration will lead to unpredictable results that may compromise system accuracy. The software prompts for
calibration when necessary. Before proceeding with the creation of a database, it is recommended to calibrate the
system using the white reference standard.
To perform the calibration:
1. Ensure the standard is clean otherwise clean it with a moist cloth. Do not use acetone or alcohol.
2. Access the calibration panel on the software menu.
3. Apply the measurement aperture of the colorimeter to the calibration standard and click the Acquire button.
5.9 ADVANCED FEATURES
5.9.1 DATABASE MANAGEMENT
The colours acquired and added to the Measures and References lists are organized in databases. In this way, the
colours lists can be saved/loaded for future use. Note that the Measures and References databases are fully
interchangeable, so one can choose to use a Measures database as a References database (and vice versa) when
performing analysis.
The colours are added to the database when performing an acquisition; they can then removed by right-clicking on a
colou menu one can also add notes to the colour and rename
it.
 Loading...