6.2.DashboardPage
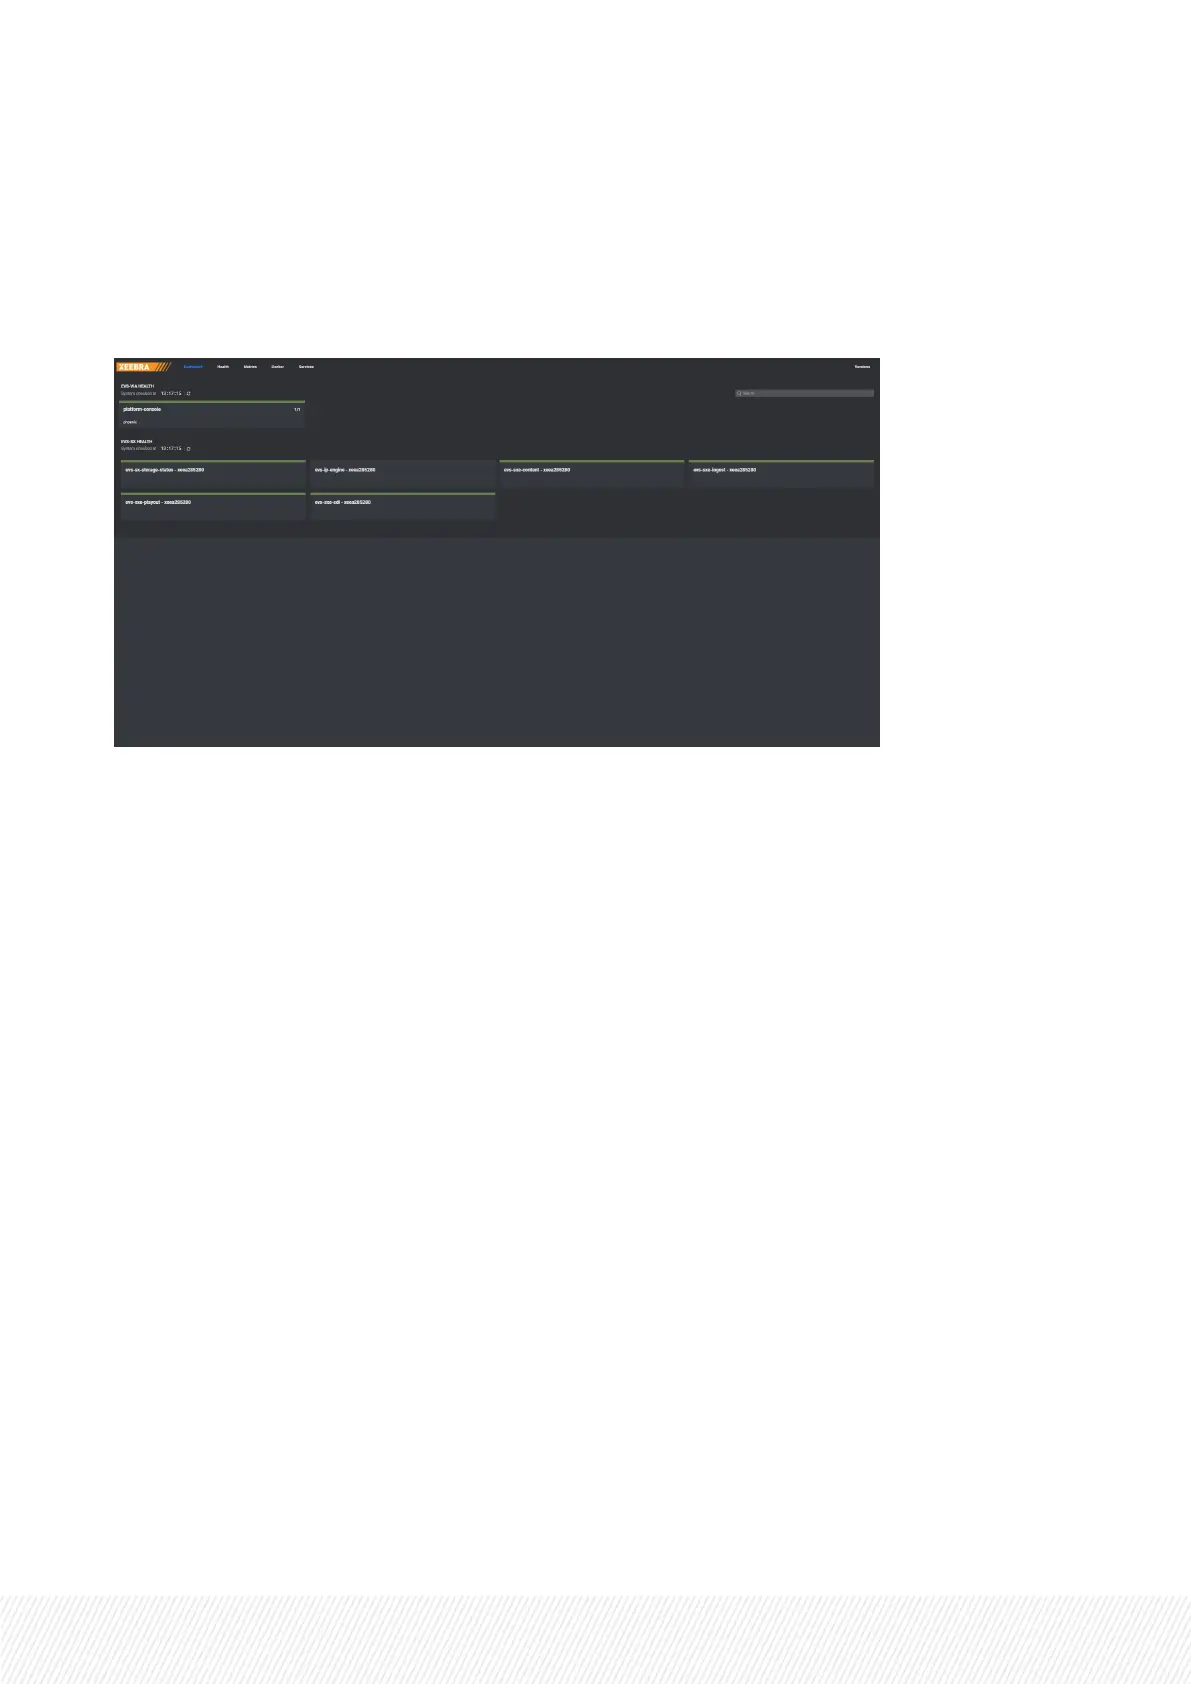
The Dashboard page allows you to view at a glance the status of the different Xeebra micro-services
and backend components. To get the latest status, click the refresh button.
The backend components can have one of the following health statuses:
• Passing (green)
• Warning (orange)
• Critical (red) In case of an error, more detailed information can be viewed.
A search bar allows you to filter the list of components and quickly find a specific backend component.
INSTALLATION AND CONFIGURATION MANUAL
Xeebra |6. Monitoring and Support| 35