Documenting Process Calibrator
Performance Verification Tests
11
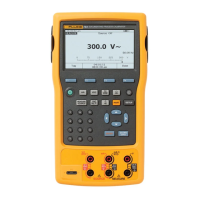
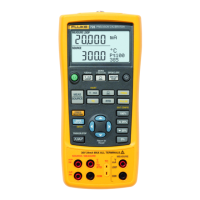
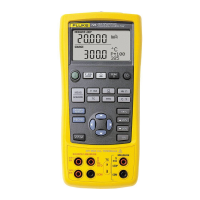
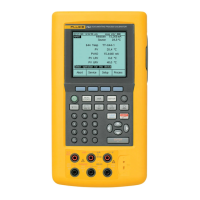
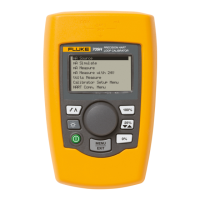
Fluke 75X
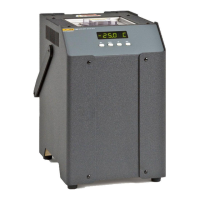
Fluke 5522A
gso03.eps
Figure 1. DC Volts and AC Volts Measurement Connections
Table 3. DC Volts Measurement Verification Points
UUT Range Input V dc
Minimum
1-Year
Maximum
1-Year
Minimum
2-Year
Maximum
2-Year
100.000 mV 0 -0.005 0.005 -0.005 0.005
100.000 mV 0.1 99.975 100.025 99.965 100.035
100.000 mV -0.1 -100.025 -99.975 -100.035 -99.965
3.00000 V 0 -0.00005 0.00005 -0.00005 0.00005
3.00000 V 1.0 0.99975 1.00025 0.99965 1.00035
3.00000 V 2.0 1.99955 2.00045 1.99935 2.00065
3.00000 V 3 2.99935 3.00065 2.99905 3.00095
3.00000 V -3 -3.00065 -2.99935 -3.00095 -2.99905
30.0000 V 0 -0.0005 0.0005 -0.0005 0.0005
30.0000 V 30 29.9935 29.9870 29.9905 30.0095
30.0000 V -30 -30.0065 -29.9935 -30.0095 -29.9905
300.00 V 0 -0.05 0.05 -0.05 0.05
300.00 V 295 294.80 295.20 294.74 295.26
300.00 V -295 -295.20 -294.80 -295.26 -294.74