Front-Panel Operation
Using the Analyze Functions 3
3-15
plot point. Previously laid down plot marks are adjusted down in size proportionally to
the new vertical axis.
The left section of the Meter’s display indicates the highest (maximum) and lowest
(minimum) reading taken since the start of a TrendPlot session. In addition, the length of
the TrendPlot session is displayed in hours, minutes, and seconds (hh:mm:ss).
To start a TrendPlot session:
1. Set up the Meter for the desired measurement by selecting the function and
connecting the signal to the Meter’s input.
Note
Setting the range function to manual will cause the Trendplot display to
plot at the top or bottom edge of the plot area without making an amplitude
adjustment when the input signal exceeds the limits of the Meter’s range.
2. With the Meter taking measurements, press J.
3. Press the TREND PLOT soft key to start the session.
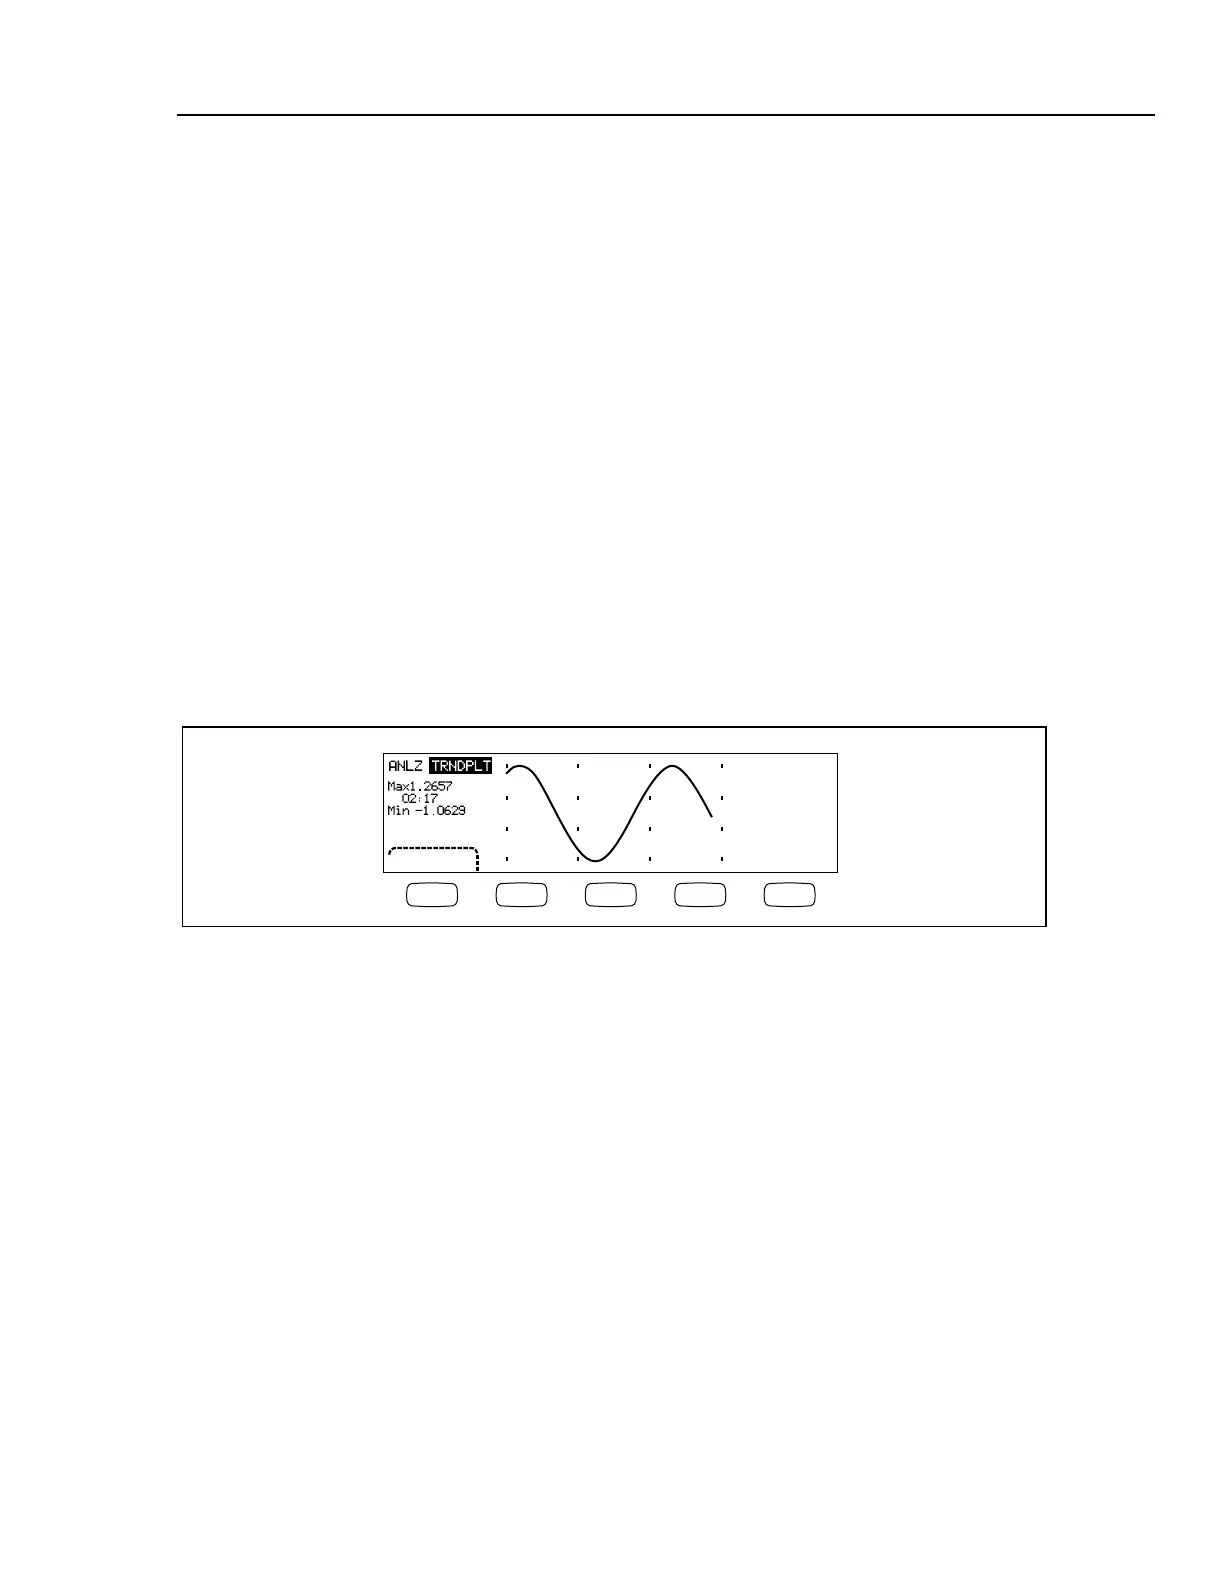
As shown in Figure 3-1, the display will start plotting the readings across the plot area,
and the maximum, minimum, and elapsed time are displayed. When there are longer
intervals or delays between readings, TrendPlot will initially look like unconnected dots
until enough time elapses to gather more readings.
STOP
F1 F2 F3 F4 F5
caw057.eps
Figure 3-1. TrendPlot Display
To stop the TrendPlot session, press B or the STOP soft key.
To start the TrendPlot session over, press the STOP soft key followed by the
RESTART soft key.
Using the Histogram Function
The Histogram function provides a graphical representation of the standard deviation of a
series of measurements. The right two-thirds of the Meter’s display is used as a bar graph
chart. The vertical axis is a relative measure of the number of readings while 10 vertical
bars represent the standard deviation across the horizontal axis. The two center bars
indicates the number of readings that fall on either side of the average reading within the
1
st
standard deviation. The two bars on either side of the center two bars represent the
number of readings that fall within the 2
nd
standard deviation. The next two represent the
3
rd
standard deviation and so on to the 5
th
standard deviation.
The histogram function is helpful in looking at the standard distribution of the UUT.
While observing the bar graph display (see Figure 3-2), adjust the UUT variable control
to peak the center two bars of the histogram.