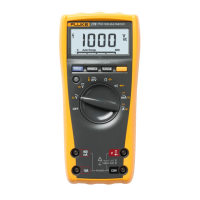
Digital Multimeter
Using the Bar Graph
11
Using the Bar Graph
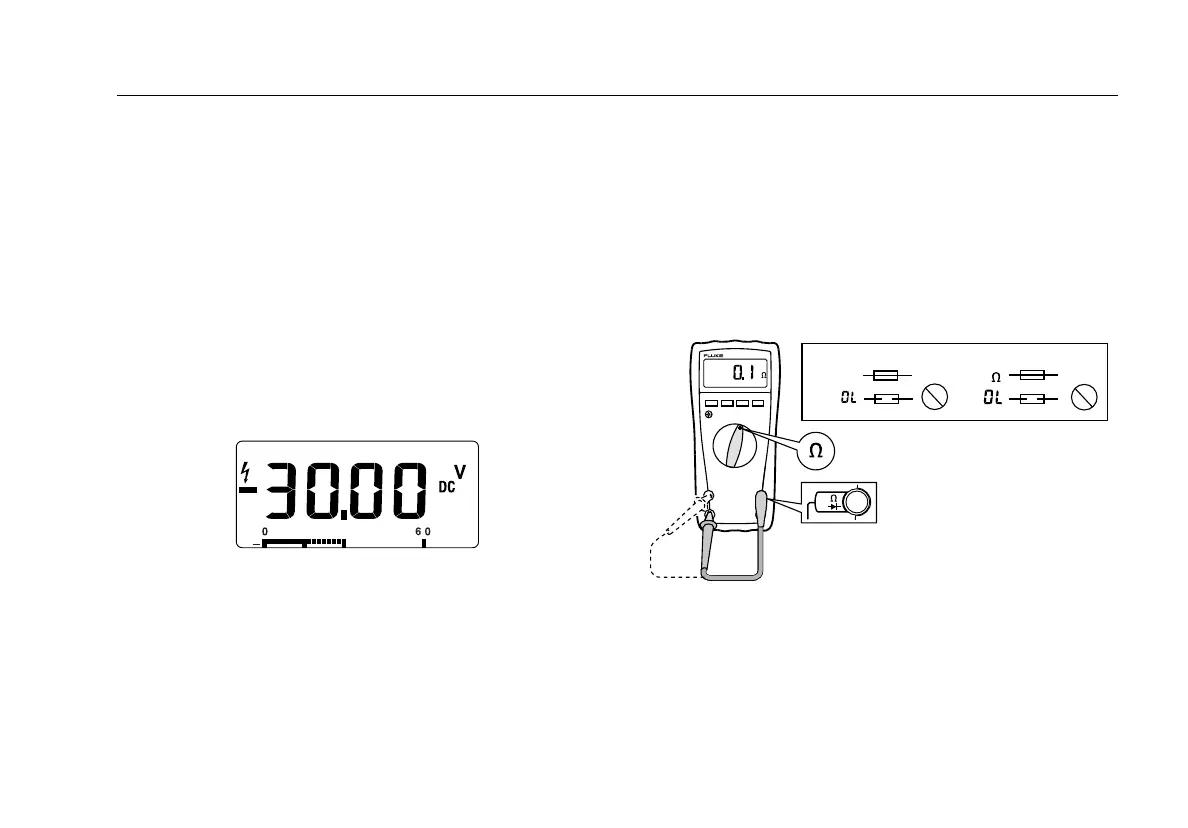
The bar graph is like the needle on an analog Meter. There is an
overload indicator (►) to the right, and a polarity indicator (±) to
the left.
Because the bar graph is much faster than the digital display, the
bar graph is useful for making peak and null adjustments, and for
observing rapidly changing inputs.
The bar graph is disabled when measuring capacitance. In
frequency, the bar graph accurately indicates the voltage or
current up to 1 kHz.
The number of lit segments indicates the measured value and is
relative to the full-scale value of the selected range.
For example, in the 60 V range (see below), the major divisions on
the scale represent 0, 15, 30, 45, and 60 V. An input of −30 V
lights the negative sign and the segments up to the middle of the
scale.
AIK11F.EPS
Cleaning
Wipe the case with a damp cloth and mild detergent. Do not use
abrasives or solvents. Dirt or moisture in the terminals can affect
readings.
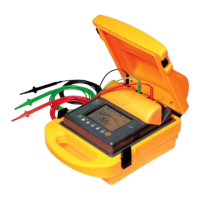
Testing the Fuses
XWWarning
To avoid electrical shock or injury, remove the test
leads and any input signals before replacing the fuse.
Test fuses as shown below.
11 A 440 mA
<0.5
Ω
<12
OKOK
OK
OK
RANGEHOLD
MIN MAX
V
AIK12F.EPS