21
The limitation therefore specifies an
absolute reactive power limit, below which
the control band does not go.
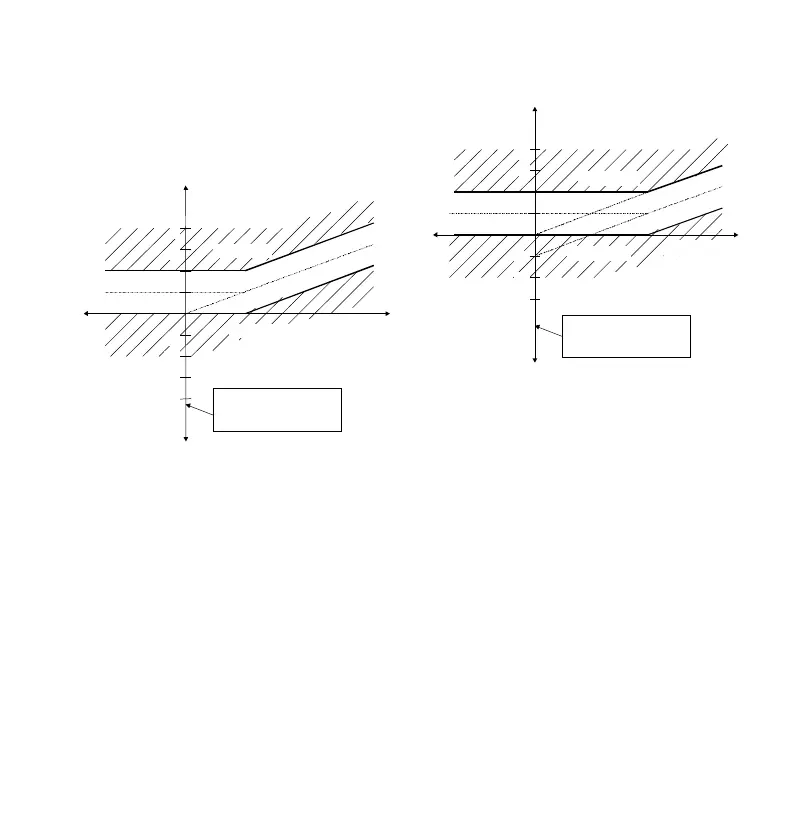
Figure 8: Control response after setting
target power factor = 0.92 ind; PS = 0;
L = +1.0
Active power
Reactive current
3
4
-1
-2
ind
cap
Regeneration
One scale division
corresponds to 0.65 *
smallest capacitor stage
This setting has the following effects:
• The power factor is attained, on the
average, in the "upper" power range.
• Over-compensation (capacitive load) is
avoided in the low load range.
An appropriate combination of "parallel
shift" and "limitation" is illustrated in
Figure 9.
Figure 9: Control response after setting
target power factor = 0.92 ind; PS = -1.0;
L = +1.0
3
Reactive current
4
-1
ind
cap
Regeneration
Switched on
Switched off
One scale division
corresponds to 0.65 *
smallest capacitor stage
Active power
-2
-3
This example illustrates:
• In the "upper" power range the set
power factor is specified as the lower
limit value.
• Over-compensation is avoided in the
low load range.
This setting is the normal setting
on delivery from the factory and
represents the best possible control
characteristic for most applications.
The following Figure 10 shows the
characteristics of the control band when
set for a capacitive target power factor. In