7. HOW TO MANAGE CHARTS
7-16
5) [C-MAP Collections]
A collection is a pre-defined dataset, the contents of which can be defined by zone,
individual chart or any of those combinations. Applicable to C-MAP charts also.
6) [Official]
Display official or unofficial charts.
7) [Up-to-date]
Display charts which are or are not up to date.
8) [Purpose]
Display chart according to its purpose - [Overview], [General], [Coastal], [AIO],
[Approach], [Harbour], [Berthing].
9) [Group]
See the next section for how to group charts.
10)[Route]
Show or hide chart area with route.
11)Chart boundary boxes
Define the area covered by a chart and are color-coded according license and per-
mit status.
12) [Line Color Legend]
The line color legend provides information about license validity.
7.13.1 How to group chart cells
You can define groups of like-format chart cells. This means you can collect related
charts, for example, all cells that cover a route from Liverpool to New York or all cells
available from a National Hydrographic Office.
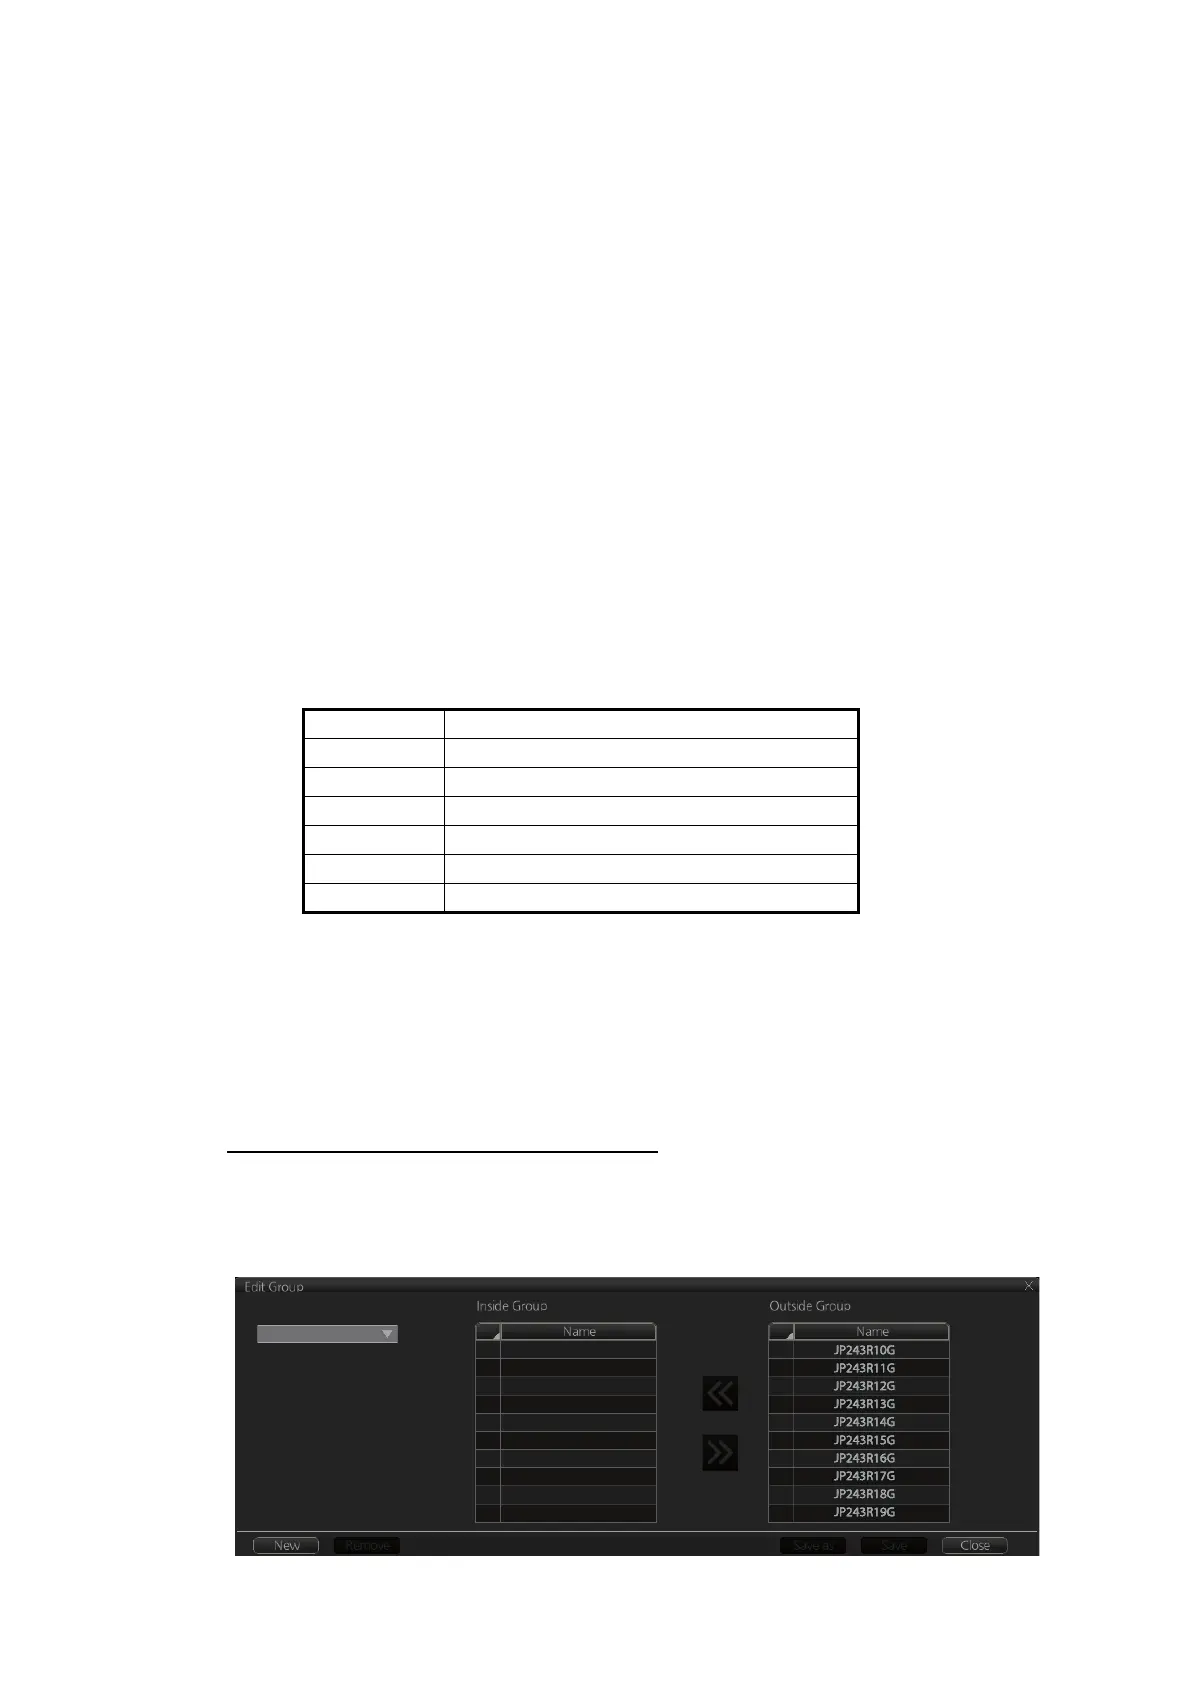
You can make a group and define charts from the [Edit Group] dialog box.
How to make a new group of chart cells
1. In the Chart maintenance mode, click the [Manage Charts] button on the
InstantAccess bar.
2. Click the [Edit] button in the [Filter] window to show the [Edit Group] dialog box.
Color Message
Green License ok, chart is up-to-date
Yellow DL issued, not reported
Orange License ok, chart is not up-to-date
Magenta License available, chart not installed
Red Not available or expired
Blue Canceled chart
Group Name:

 Loading...