4 Fishnder 350C Owner’s Manual
Adjusting the Split of the Split-Zoom Sonar View
You can adjust the height of the magnied portion of the split-zoom sonar view.
From the split-zoom sonar view , select MENU > Setup > Sonar Setup > Split
Size > Large.
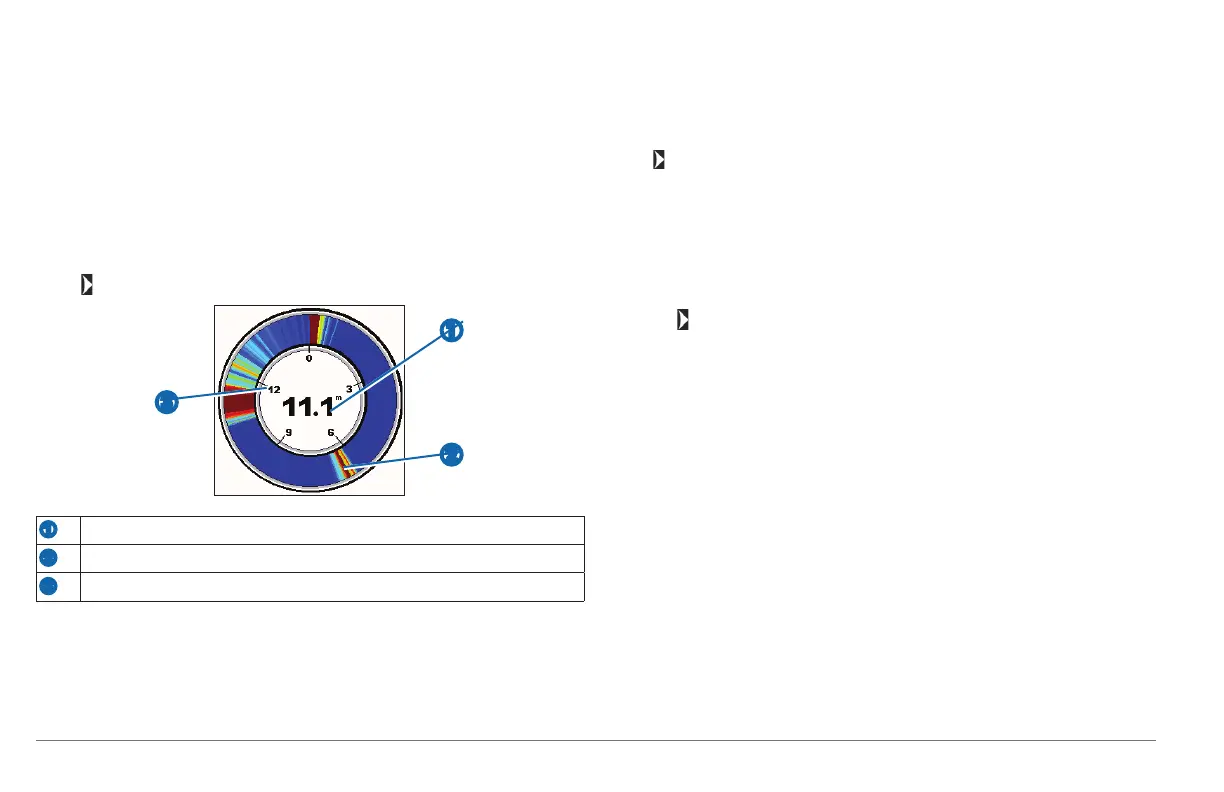
Flasher Page
The asher displays vertical sonar information in a circular format, which is
especially helpful for vertical shing, like ice shing. The surface of the water is at
the top of the circle, and the depth increases clockwise around the asher. As sonar
returns are received, the returns are shown on the ring at the depth indicated. The
colors indicate different strengths of the sonar return (page 7).
Select > Flasher.
➋
➊
➌
➊
Depth at your present location
➋
Suspended target
➌
Depth
Split-Frequency Sonar View
NOTE: The split-frequency sonar view requires the use of a dual-frequency
transducer.
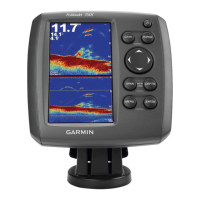
On the split-frequency view, the top half of the screen shows 77 kHz frequency
sonar data, and the bottom half of the screen shows 200 kHz frequency sonar data.
Select > Split Frequency.
NOTE: You cannot press the keys twice to open the shortcut menu on the split-
frequency sonar view.
Opening the Log Page
You can view a log of depth readings and temperature readings, when connected to
a temperature-capable transducer.
1
Select > Log.
2
If necessary, select MENU > Change Log and select a view.
Adjusting the Log Views
Before you can set up a specic log, you must open the specic log or the split-
screen log.
1
From the log page, select MENU > Depth Log Options.
2
Select one or more options:
• Select Duration to view data over a longer or shorter period of time.
Increasing the duration allows you to view data variations over a longer
period of time. Decreasing the duration allows you to view more detail over a
shorter period of time.
• Select Scale to set the temperature-range or depth-range scale.
Increasing the scale allows you to view more variations in depth or
temperature. Decreasing the scale allows you to view more detail. When the
scale is set to Auto, the scale automatically adjusts to display all the data
within the selected duration.
190-01440-00_0B.indd 4 3/21/2012 1:00:08 PM