Temperature Fields
Name Description
24-Hour
Maximum
The maximum temperature recorded in
the last 24hours from a compatible
temperature sensor.
24-Hour
Minimum
The minimum temperature recorded in
the last 24hours from a compatible
temperature sensor.
Temperature
The temperature of the air. Your body
temperature affects the temperature
sensor. You can pair a tempe sensor
with your device to provide a consistent
source of accurate temperature data.
Timer Fields
Name Description
Average Lap
Time
The average lap time for the current
activity.
Elapsed Time
The total time recorded. For example,
if you start the activity timer and run
for 10 minutes, then stop the timer for
5 minutes, then start the timer and run
for 20 minutes, your elapsed time is 35
minutes.
Name Description
Interval Time
The stopwatch time for the current
interval.
Lap Time The stopwatch time for the current lap.
Last Lap Time
The stopwatch time for the last
completed lap.
Moving Time
The total time moving for the current
activity.
Multisport
Time
The total time for all sports in a multi
sport activity, including transitions.
Set Timer
During a strength training activity, the
amount of time spent in the current
workout set.
Stopped Time
The total time stopped for the current
activity.
Swim Time
The swimming time for the current
activity, not including rest time.
Timer The current time of the countdown timer.
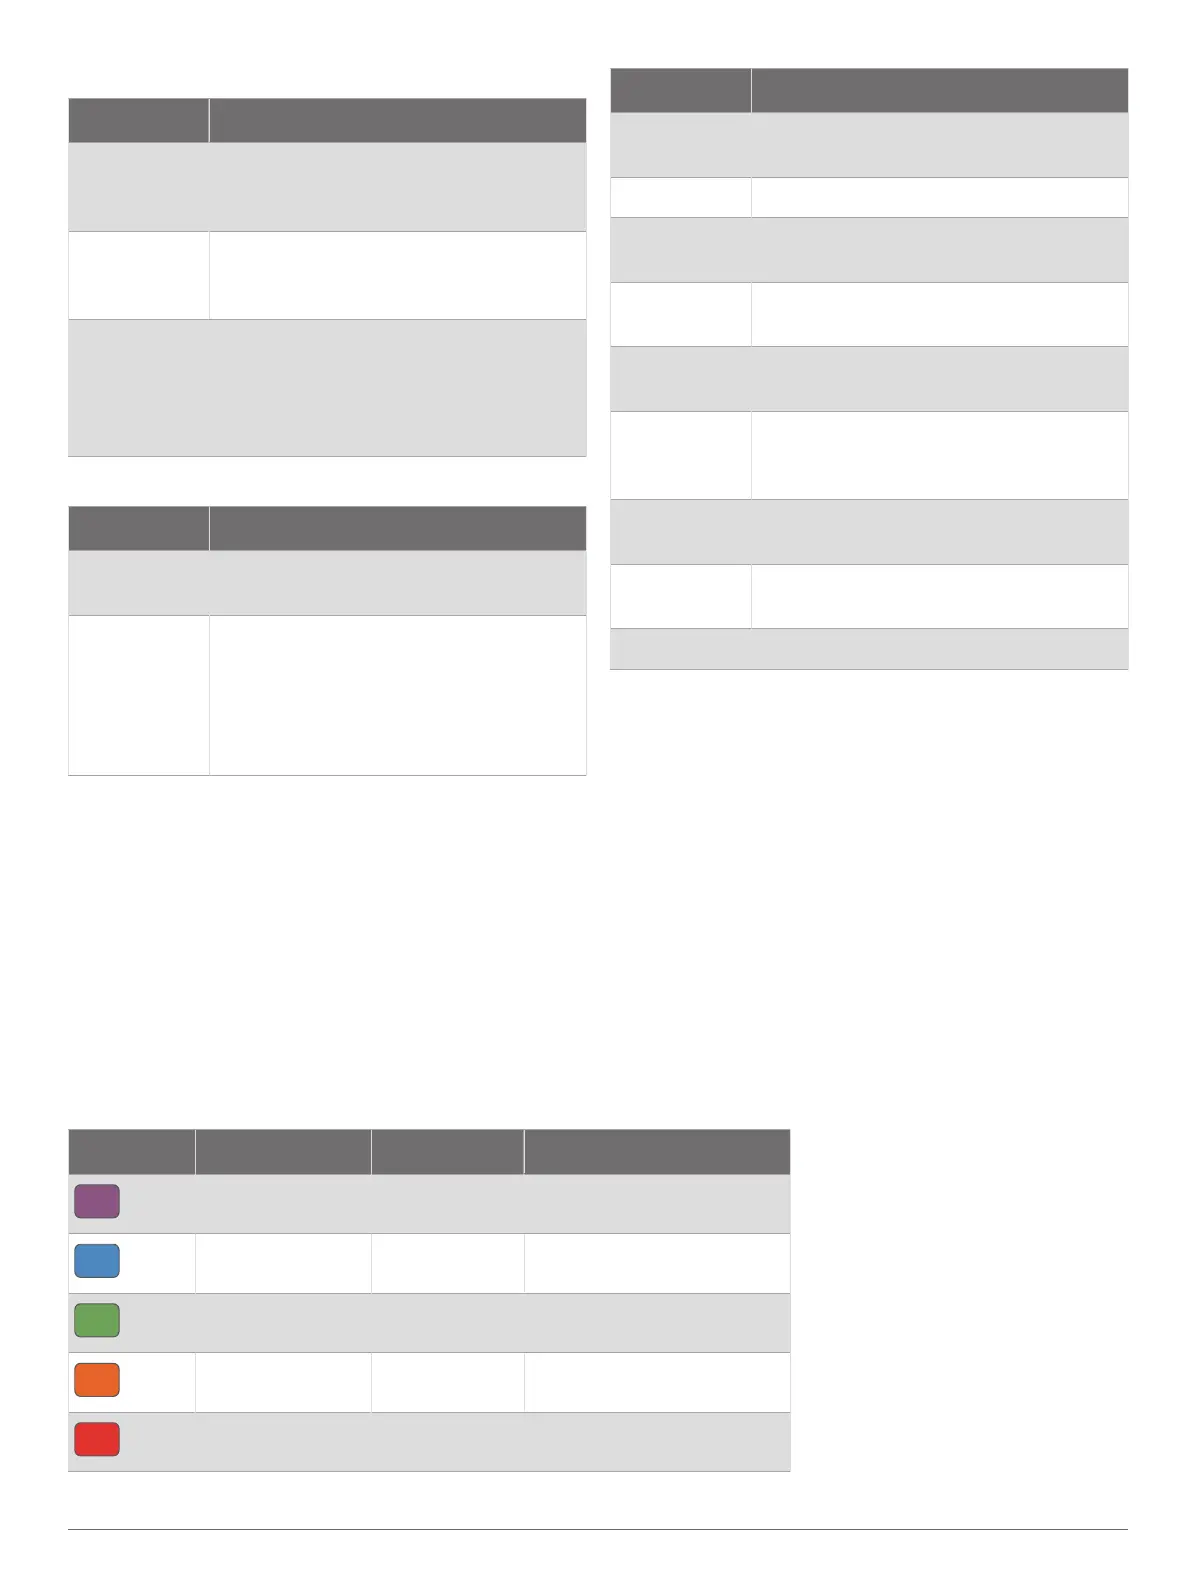
Color Gauges and Running Dynamics Data
The running dynamics screens display a color gauge for the primary metric. You can display cadence, vertical
oscillation, ground contact time, ground contact time balance, or vertical ratio as the primary metric. The color gauge
shows you how your running dynamics data compare to those of other runners. The color zones are based on
percentiles.
Garmin has researched many runners of all different levels. The data values in the red or orange zones are typical for
less experienced or slower runners. The data values in the green, blue, or purple zones are typical for more experienced
or faster runners. More experienced runners tend to exhibit shorter ground contact times, lower vertical oscillation,
lower vertical ratio, and higher cadence than less experienced runners. However, taller runners typically have slightly
slower cadences, longer strides, and slightly higher vertical oscillation. Vertical ratio is your vertical oscillation divided
by stride length. It is not correlated with height.
Go to garmin.com/runningdynamics for more information on running dynamics. For additional theories and
interpretations of running dynamics data, you can search reputable running publications and websites.
Color Zone Percentile in Zone Cadence Range Ground Contact Time Range
Purple
>95 >183spm <218ms
Blue
70–95 174–183spm 218–248ms
Green
30–69 164–173spm 249–277ms
Orange
5–29 153–163spm 278–308ms
Red
<5 <153spm >308ms
Appendix 73