Ground Contact Time Balance Data
Ground contact time balance measures your running symmetry and appears as a percentage of your total ground
contact time. For example, 51.3% with an arrow pointing left indicates the runner is spending more time on the ground
when on the left foot. If your data screen displays both numbers, for example 48–52, 48% is the left foot and 52% is the
right foot.
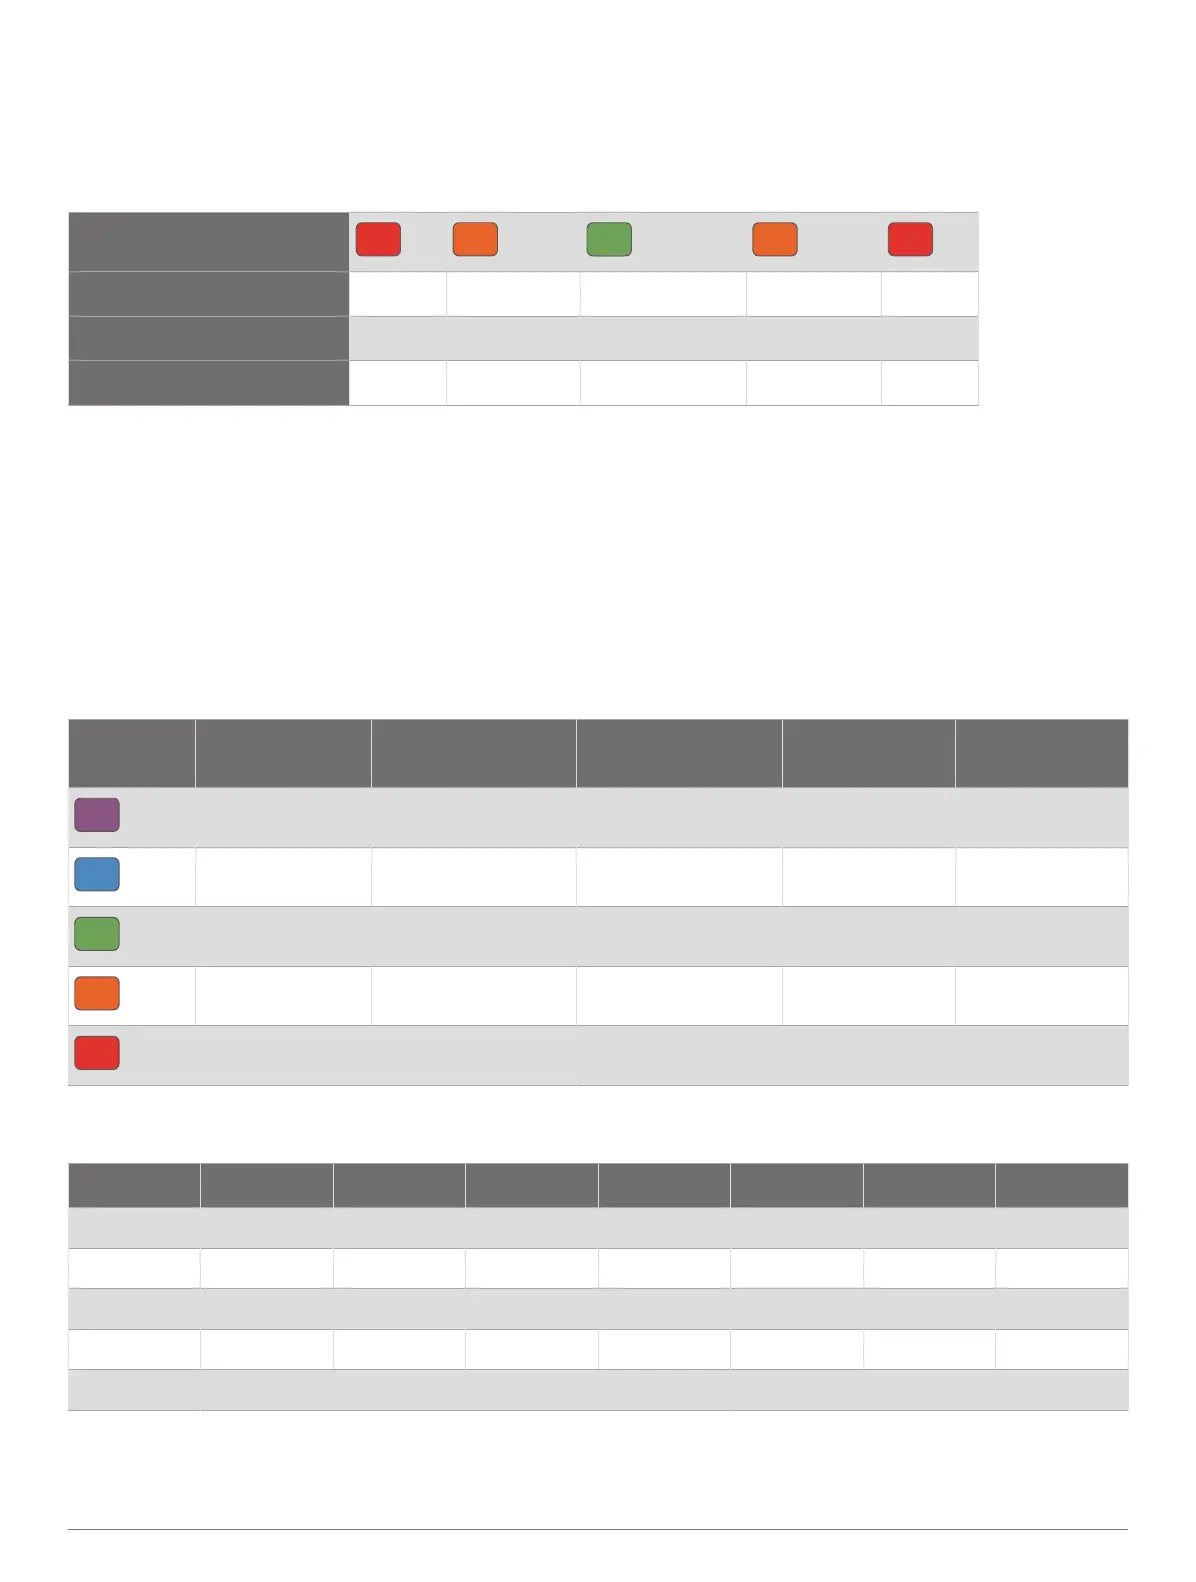
Color Zone
Red Orange Green Orange Red
Symmetry Poor Fair Good Fair Poor
Percent of Other Runners 5% 25% 40% 25% 5%
Ground Contact Time Balance >52.2%L 50.8–52.2%L 50.7%L–50.7%R 50.8–52.2%R >52.2%R
While developing and testing running dynamics, the Garmin team found correlations between injuries and greater
imbalances with certain runners. For many runners, ground contact time balance tends to deviate further from 50–50
when running up or down hills. Most running coaches agree that a symmetrical running form is good. Elite runners tend
to have quick and balanced strides.
You can watch the gauge or data field during your run or view the summary on your Garmin Connect account after your
run. As with the other running dynamics data, ground contact time balance is a quantitative measurement to help you
learn about your running form.
Vertical Oscillation and Vertical Ratio Data
The data ranges for vertical oscillation and vertical ratio are slightly different depending on the sensor and whether
it is positioned at the chest (HRM-Pro, HRM-Run
™
, or HRM-Tri accessories) or at the waist (Running Dynamics Pod
accessory).
Color Zone Percentile in Zone
Vertical Oscillation
Range at Chest
Vertical Oscillation
Range at Waist
Vertical Ratio at
Chest
Vertical Ratio at
Waist
Purple
>95 <6.4cm <6.8cm <6.1% <6.5%
Blue
70–95 6.4–8.1cm 6.8–8.9cm 6.1–7.4% 6.5–8.3%
Green
30–69 8.2–9.7cm 9.0–10.9cm 7.5–8.6% 8.4–10.0%
Orange
5–29 9.8–11.5cm 11.0–13.0cm 8.7–10.1% 10.1–11.9%
Red
<5 >11.5cm >13.0cm >10.1% >11.9%
VO2 Max. Standard Ratings
These tables include standardized classifications for VO2 max. estimates by age and gender.
Males Percentile 20–29 30–39 40–49 50–59 60–69 70–79
Superior 95 55.4 54 52.5 48.9 45.7 42.1
Excellent 80 51.1 48.3 46.4 43.4 39.5 36.7
Good 60 45.4 44 42.4 39.2 35.5 32.3
Fair 40 41.7 40.5 38.5 35.6 32.3 29.4
Poor 0–40 <41.7 <40.5 <38.5 <35.6 <32.3 <29.4
74 Appendix