Fig.6-5
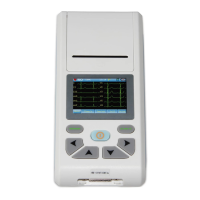
The left side of the interface (as Fig.6-5) is the waveform display window, showing the waves of
all analyses leads. Here need operators choose a meaningful wave to diagnose and adjust the
value of ST segment. Look at the picture. The three colored lines from left to right are baseline
point, ST segment beginning point, and ST segment ending point. If you want to adjust a line,
click this line to select it, and then move it through "←→" on the keyboard.
The right side of the picture is the control window, well the "Artificial Analyze" option is
designed for extending function.