Event marker, including the blue lines and "Event" in the waveform area and the blue lines in the
trend graphic area, shows the operator has press the event button on this position and recorded an
event.
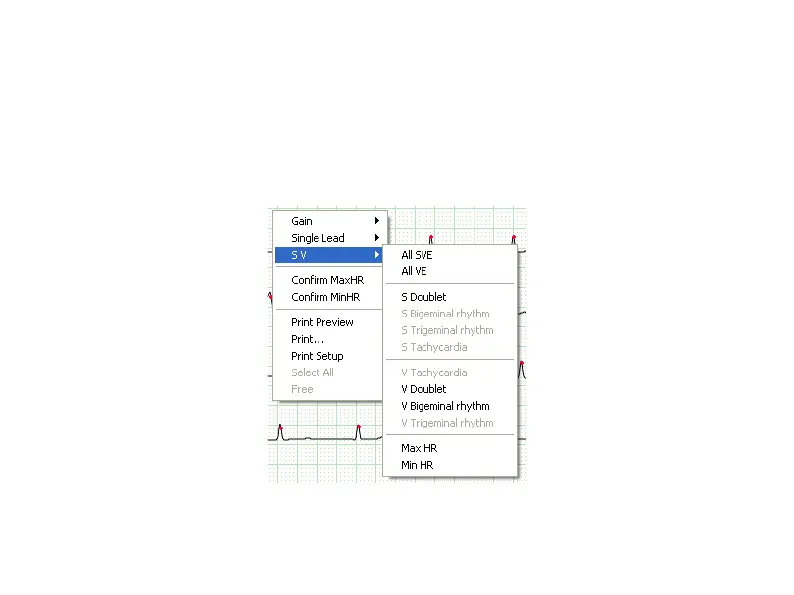
Put the arrowhead on the ECG and click the right key of the mouse, then appear the menu as
Fig.6-12. The physician can examine and analyze the ECG according to what he needs.
Fig.6-12