4. Push Enter. The distributor arm moves to the selected bottle.
Note: To stop the distributor arm at any time, push STOP.
Start or stop the pump
Operate the pump manually to collect a sample or purge the intake tubing.
1. Push MANUAL OPERATION.
2. Select Operate Pump.
3. Select an option.
Option Description
Pump (Run Forward) The pump operates in the forward direction to collect a sample and deposit the
sample in a sample container.
Purge (Run Backward) The pump operates in the reverse direction to purge the intake tubing.
4. Push STOP to stop the pump.
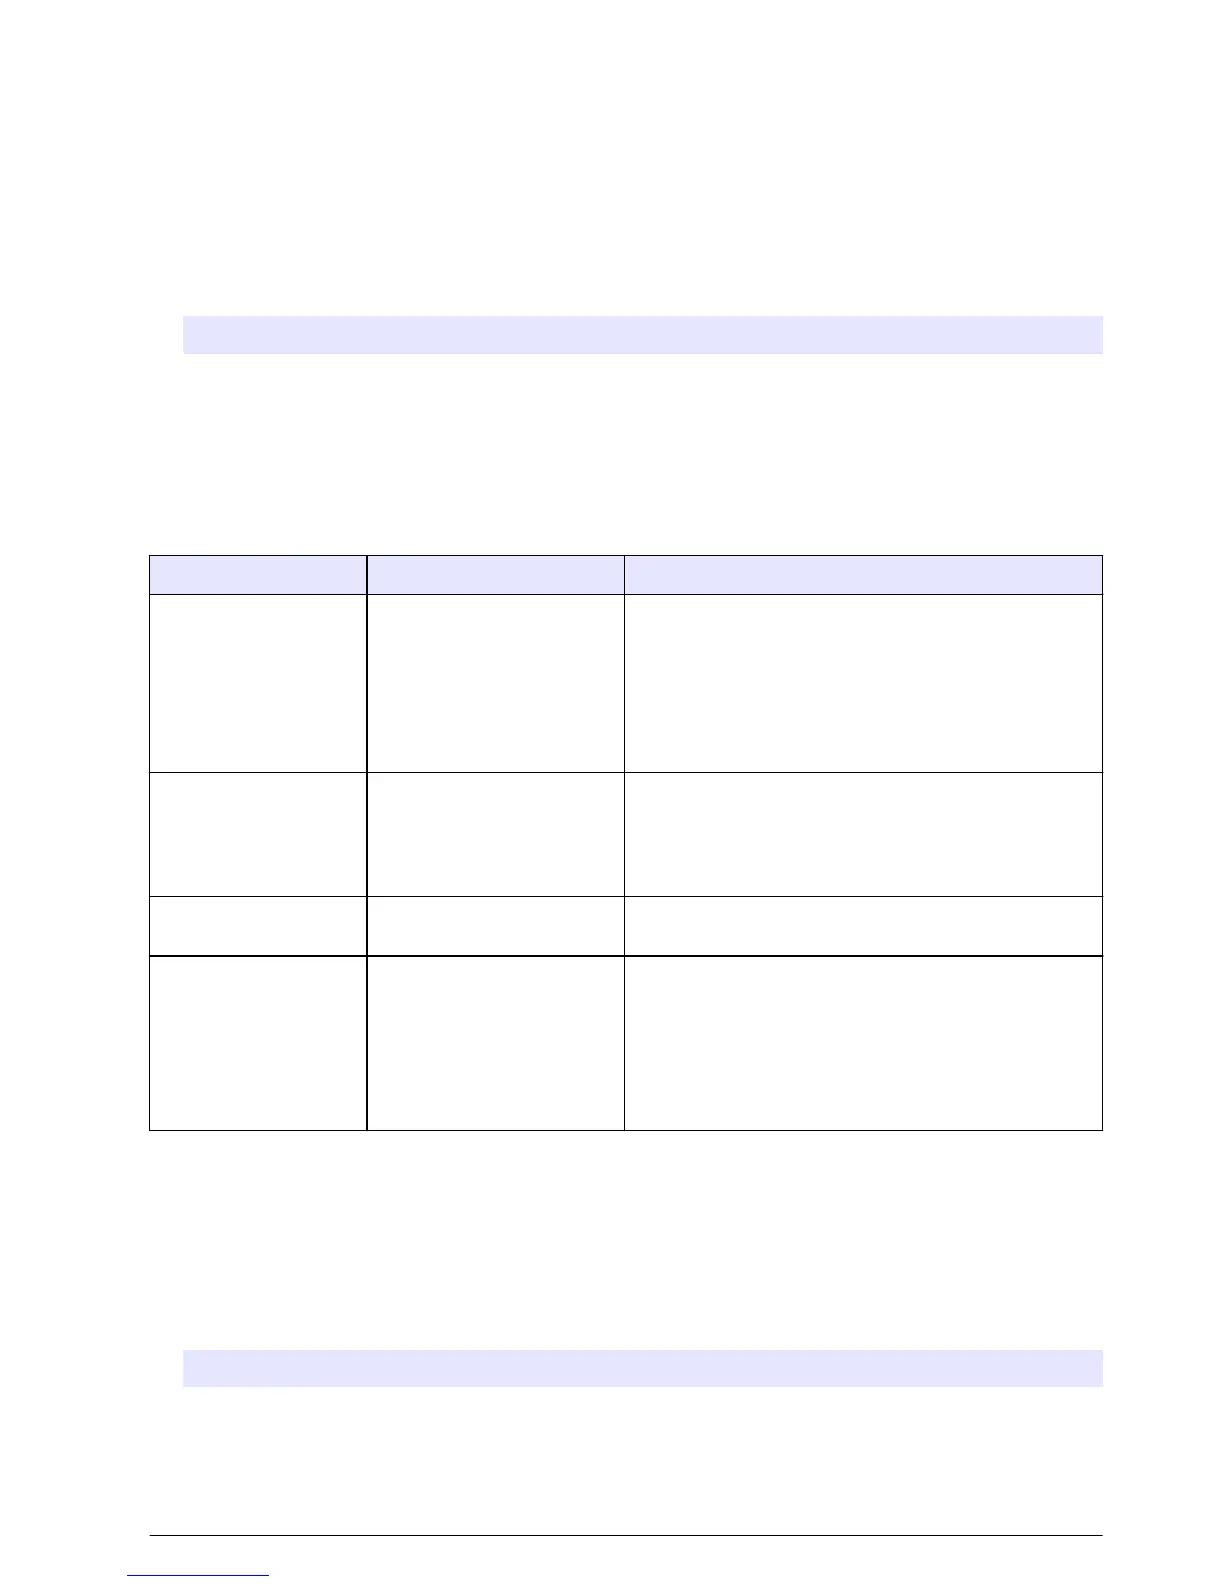
Troubleshooting
Problem Possible cause Solution
The red indicator light
flashes.
One or more measurements
that the sampler is
configured to use (e.g., pH
and flow) is not available
because the sensor(s) is not
connected to the sampler.
Connect the missing sensor to the sampler or make
sure that the sampler is not configured:
• To record sensor measurements to the data log that
are not available.
• With alarms for sensor measurements that are not
available.
"---" shows on the
Status screen.
The measurement is not
available or has not been
recorded yet.
The measured values shown are the last recorded
value. Measurement data is recorded to the data log in
accordance with the selected logging interval.
Make sure that the measurement is supplied to the
sampler.
No measurement data
shows.
The data log is empty. Measurement data is recorded to the data log in
accordance with the selected logging interval.
Some measurements
supplied to the sampler
do not show on the
Status screen or the
Measurement Data
screen.
Only the measurements
recorded to the data log
show.
Refer to Configure data logging on page 11.
To see all the measurements supplied to the sampler
by a sensor(s) connected to a sensor port, select
Diagnostics>Sensor Ports.
To show all the measurements supplied to the sampler
by an external instrument(s) that is connected to the
AUX I/O port, select Diagnostics>AUX and I/O Port.
Do a diagnostic test
Use the diagnostic tests to examine the operation of individual components.
1. Push MENU.
2. Select DIAGNOSTICS.
3. Select an option.
Option Description
Status Shows the Status screen. Refer to Show the program status on page 24.
Event Log Shows the event log. Refer to Show the event log on page 26.
Alarm Log Shows the alarm log. Refer to Show the alarm log on page 27.
English 29