Main Feature Description
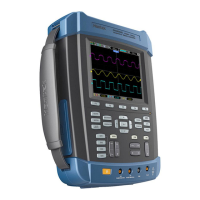
DSO1000B Series HandHeld Oscilloscope User Manual 11
4.5 Waveform Measurement
The oscilloscope displays graphs of voltage versus time and can help to measure the displayed
waveform. There are several ways to take measurements, using the graticule, the cursors or
performing an automatic measurement.
Graticule: This method allows you to make a quick, visual estimate and take a simple
measurement through the graticule divisions and the scale factor.
For example, you can take simple measurements by counting the major and minor graticule
divisions involved and multiplying by the scale factor. If you counted 6 major vertical graticule
divisions between the minimum and maximum values of a waveform and knew you had a scale
factor of 50mV/division, you could easily calculate your peak-to-peak voltage as follows:
6 divisions x 50mV/division = 300mV.
Cursor: This method allows you to take measurements by moving the cursors. Cursors always
appear in pairs and the displayed readouts are just their measured values. There are two kinds of
cursors: Amplitude Cursor and Time Cursor. The amplitude cursor appear as a horizontal broken
line, measuring the vertical parameters. The time cursor appear as a vertical broken line,
measuring the horizontal parameters.
When using cursors, please make sure to set the Source to the waveform that you want to
measure on the screen. To use cursors, push the CURSOR button.
Automatic Measurement: The oscilloscope performs all the calculations automatically in this
mode. As this measurement uses the waveform record points, it is more precise than the graticule
and cursor measurements. Automatic measurements show the measurement results by readouts
which are periodically updated with the new data acquired by the oscilloscope.