Basic Operation
once it is captured. The different styles to display a waveform on the screen give significant
information about it.
There are two modes to display waveforms Single-window and Dual-window. Refer to Horizontal
Controls for more information.
Push the DISPLAY button and the following menu appears.
Options Settings Comments
Type Vectors
Dots
Vectors fills up the space between adjacent sample
points in the display; Dots only displays the sample
points.
Persist OFF
0.2S-8S selectable
Infinite
Sets the time length to display each displayed sample
point.
Format YT
XY
YT format shows the vertical voltage in relation to time
(horizontal scale); XY format displays a dot between
CH1 and CH2 each time when a sample is acquired,
where the voltage or current of CH1 determines the X
coordinate of the dot (horizontal) and the voltage or
current of CH2 determines the Y coordinate (vertical).
For detailed information, refer to descriptions on XY
format in the following text.
Contrast 0-15 16 ranks adjustable, with a progress bar to
display; Press F5 to select this option. Turn the multi-
functional knob to adjust.
Next Page
Grid Dotted line
Real line
OFF
Off only displays the horizontal and vertical
coordinates at the center graticule on the screen.
Grid Intensity 0-15 16 ranks adjustable, with a progress bar to
display.
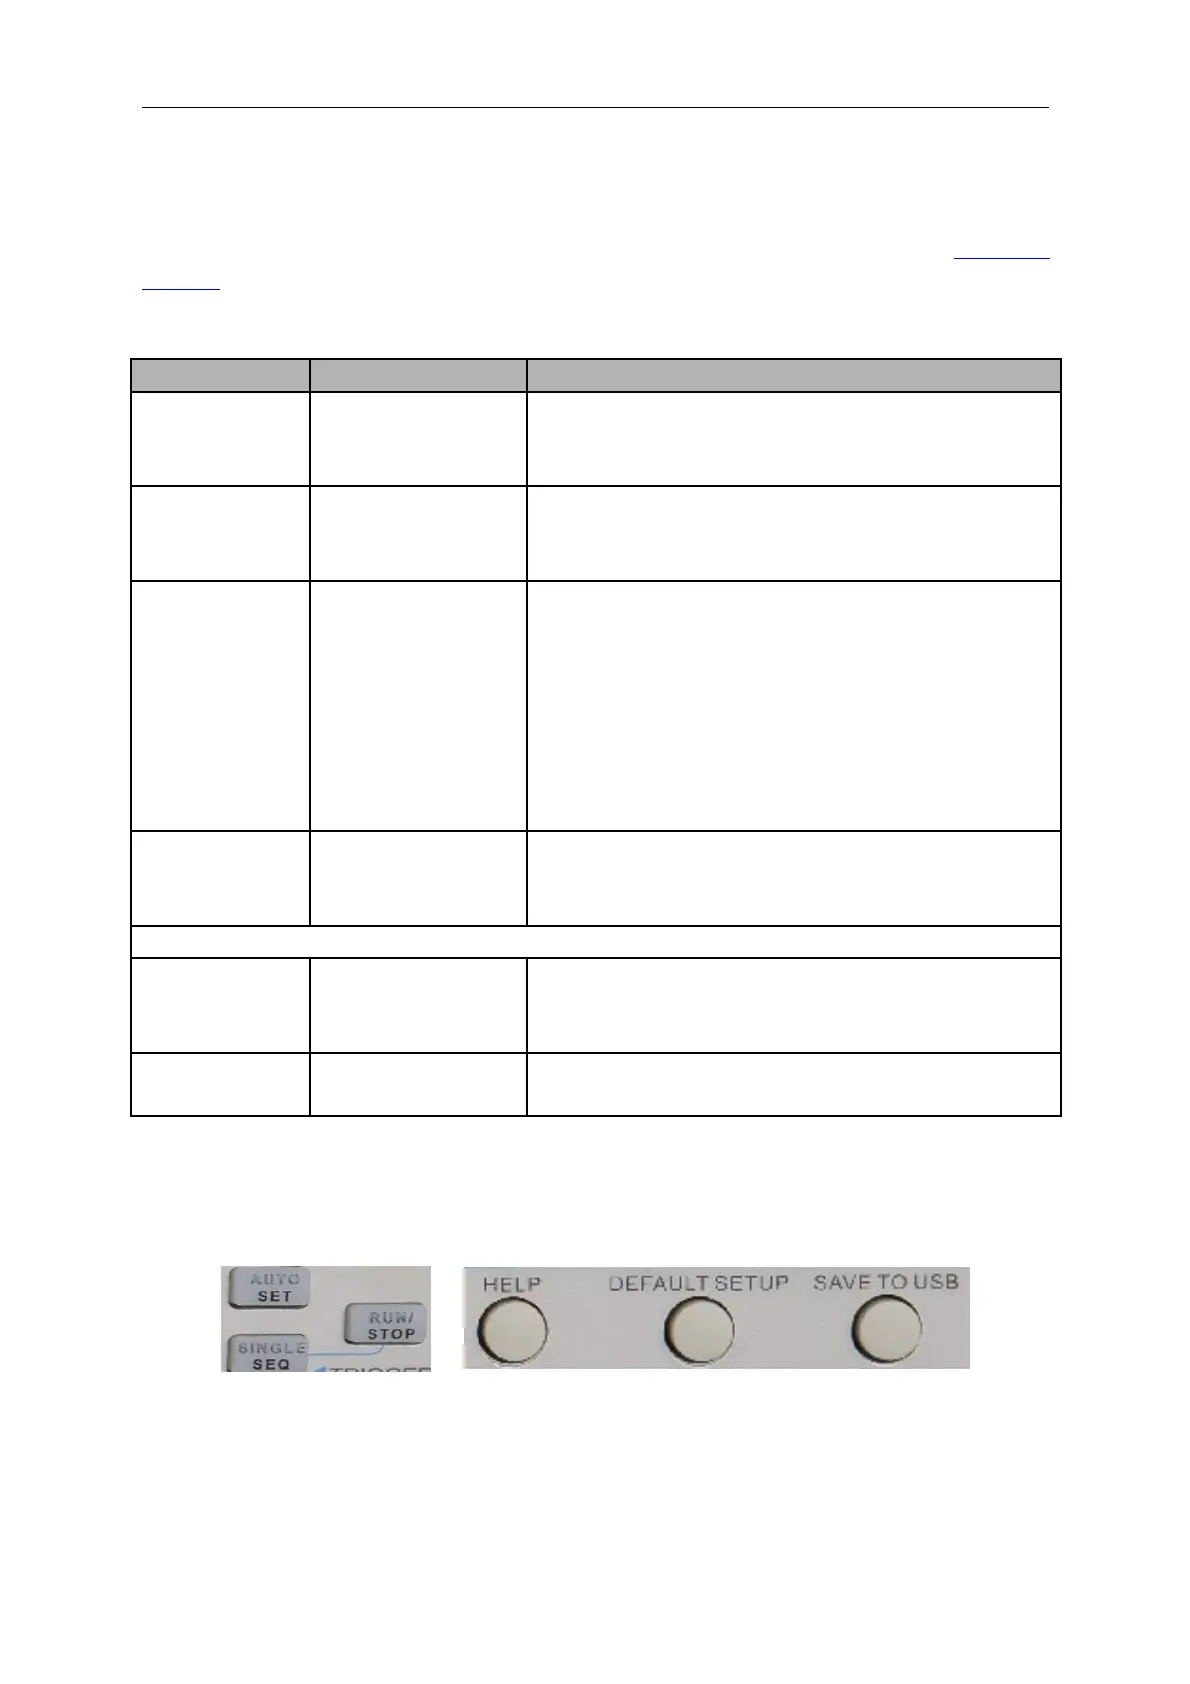
5.6 Fast Action Buttons
AUTOSET: Automatically set the oscilloscope controls to generate a usable display of the input
signals. Refer to the following table for relative content.
DSO5000 Series Digital Storage Oscilloscope User Manual 43
 Loading...