5
Verifying settings and connections
-2. Are too many events occurring?
(Is the icon shown continuously?)
If too many events are occurring, check which events are being
generated on the event list on the [EVENT] screen (see step [7])
after recording some data and then change the thresholds for
the problematic events.
Alternately, wiring (connections) to the measurement line may
be incorrect. Verify the connections.
-3. Are the voltage and current phase relationships
shown properly in the vector diagrams?
If not, the wiring (connections) to the measurement line or clamp
sensor orientations may be incorrect. Verify the connections and
clamp sensor orientations.
1
2
Example: To change the Voltage
RMS (Upper threshold)
Push
Push to
display
Select the
level setting
Change the
threshold
Accept
Move the cursor to
[U RMS High]
5
4
Push
6
User settings
You can change event thresholds, the recording
start time, recorded items, and other settings as
desired.
1
Example: To change the real-time control
start time (example: set to 12:00)
Push
2
Push to
display
Select the
value so it can
be changed
Set to
[12]
Accept value
Move the
cursor to
[h]
The time can only be changed when the [Time Start] setting is
[ON].
-1. Are measured values or crest factors out of range?
If you see any warning indicators, the clamp sensor, range, or
connection settings may be incorrect. Verify the connections and
return to step (2) to reconfigure the initial settings.
Warning indicators: Values shown in red as below.
-4. Are waveforms and measured values shown properly?
If waveforms and measured values are not shown properly, the
clamp sensor, range, or connection settings may be incorrect.
Return to step (2) to reconfigure the initial settings. Alternately,
wiring (connections) to the measurement line or clamp sensor
orientations may be incorrect.
(Voltage and crest factor out of range)
(Current and crest factor out of range)
The vectors
should resemble
a fan shape.
Event icon
Normally shown in white
but turns orange when
too many events occur.
No. of events recorded
(Max. 1,000)
Event indicator
Reaches capacity at
1,000 events.
Up to 1,000 events can be recorded. Measurement data
continues to be recorded even when the number of events
exceeds 1,000.
3
3
Push
Push to
display
Push
Push to
display
Push to
display
(changing settings)
Creating reports
You can create reports summarizing loaded measure-
ment data and either print them or save them as rich text
format (RTF) files.
Viewing data
You can view and analyze event data, TIMEPLOT data mea-
sured values, and waveforms on a computer.
Operating mode and key operation
[SETTING]
[RECORDING] [ANALYZING]
Start recording Stop recording
Revert to setting mode
Change settings
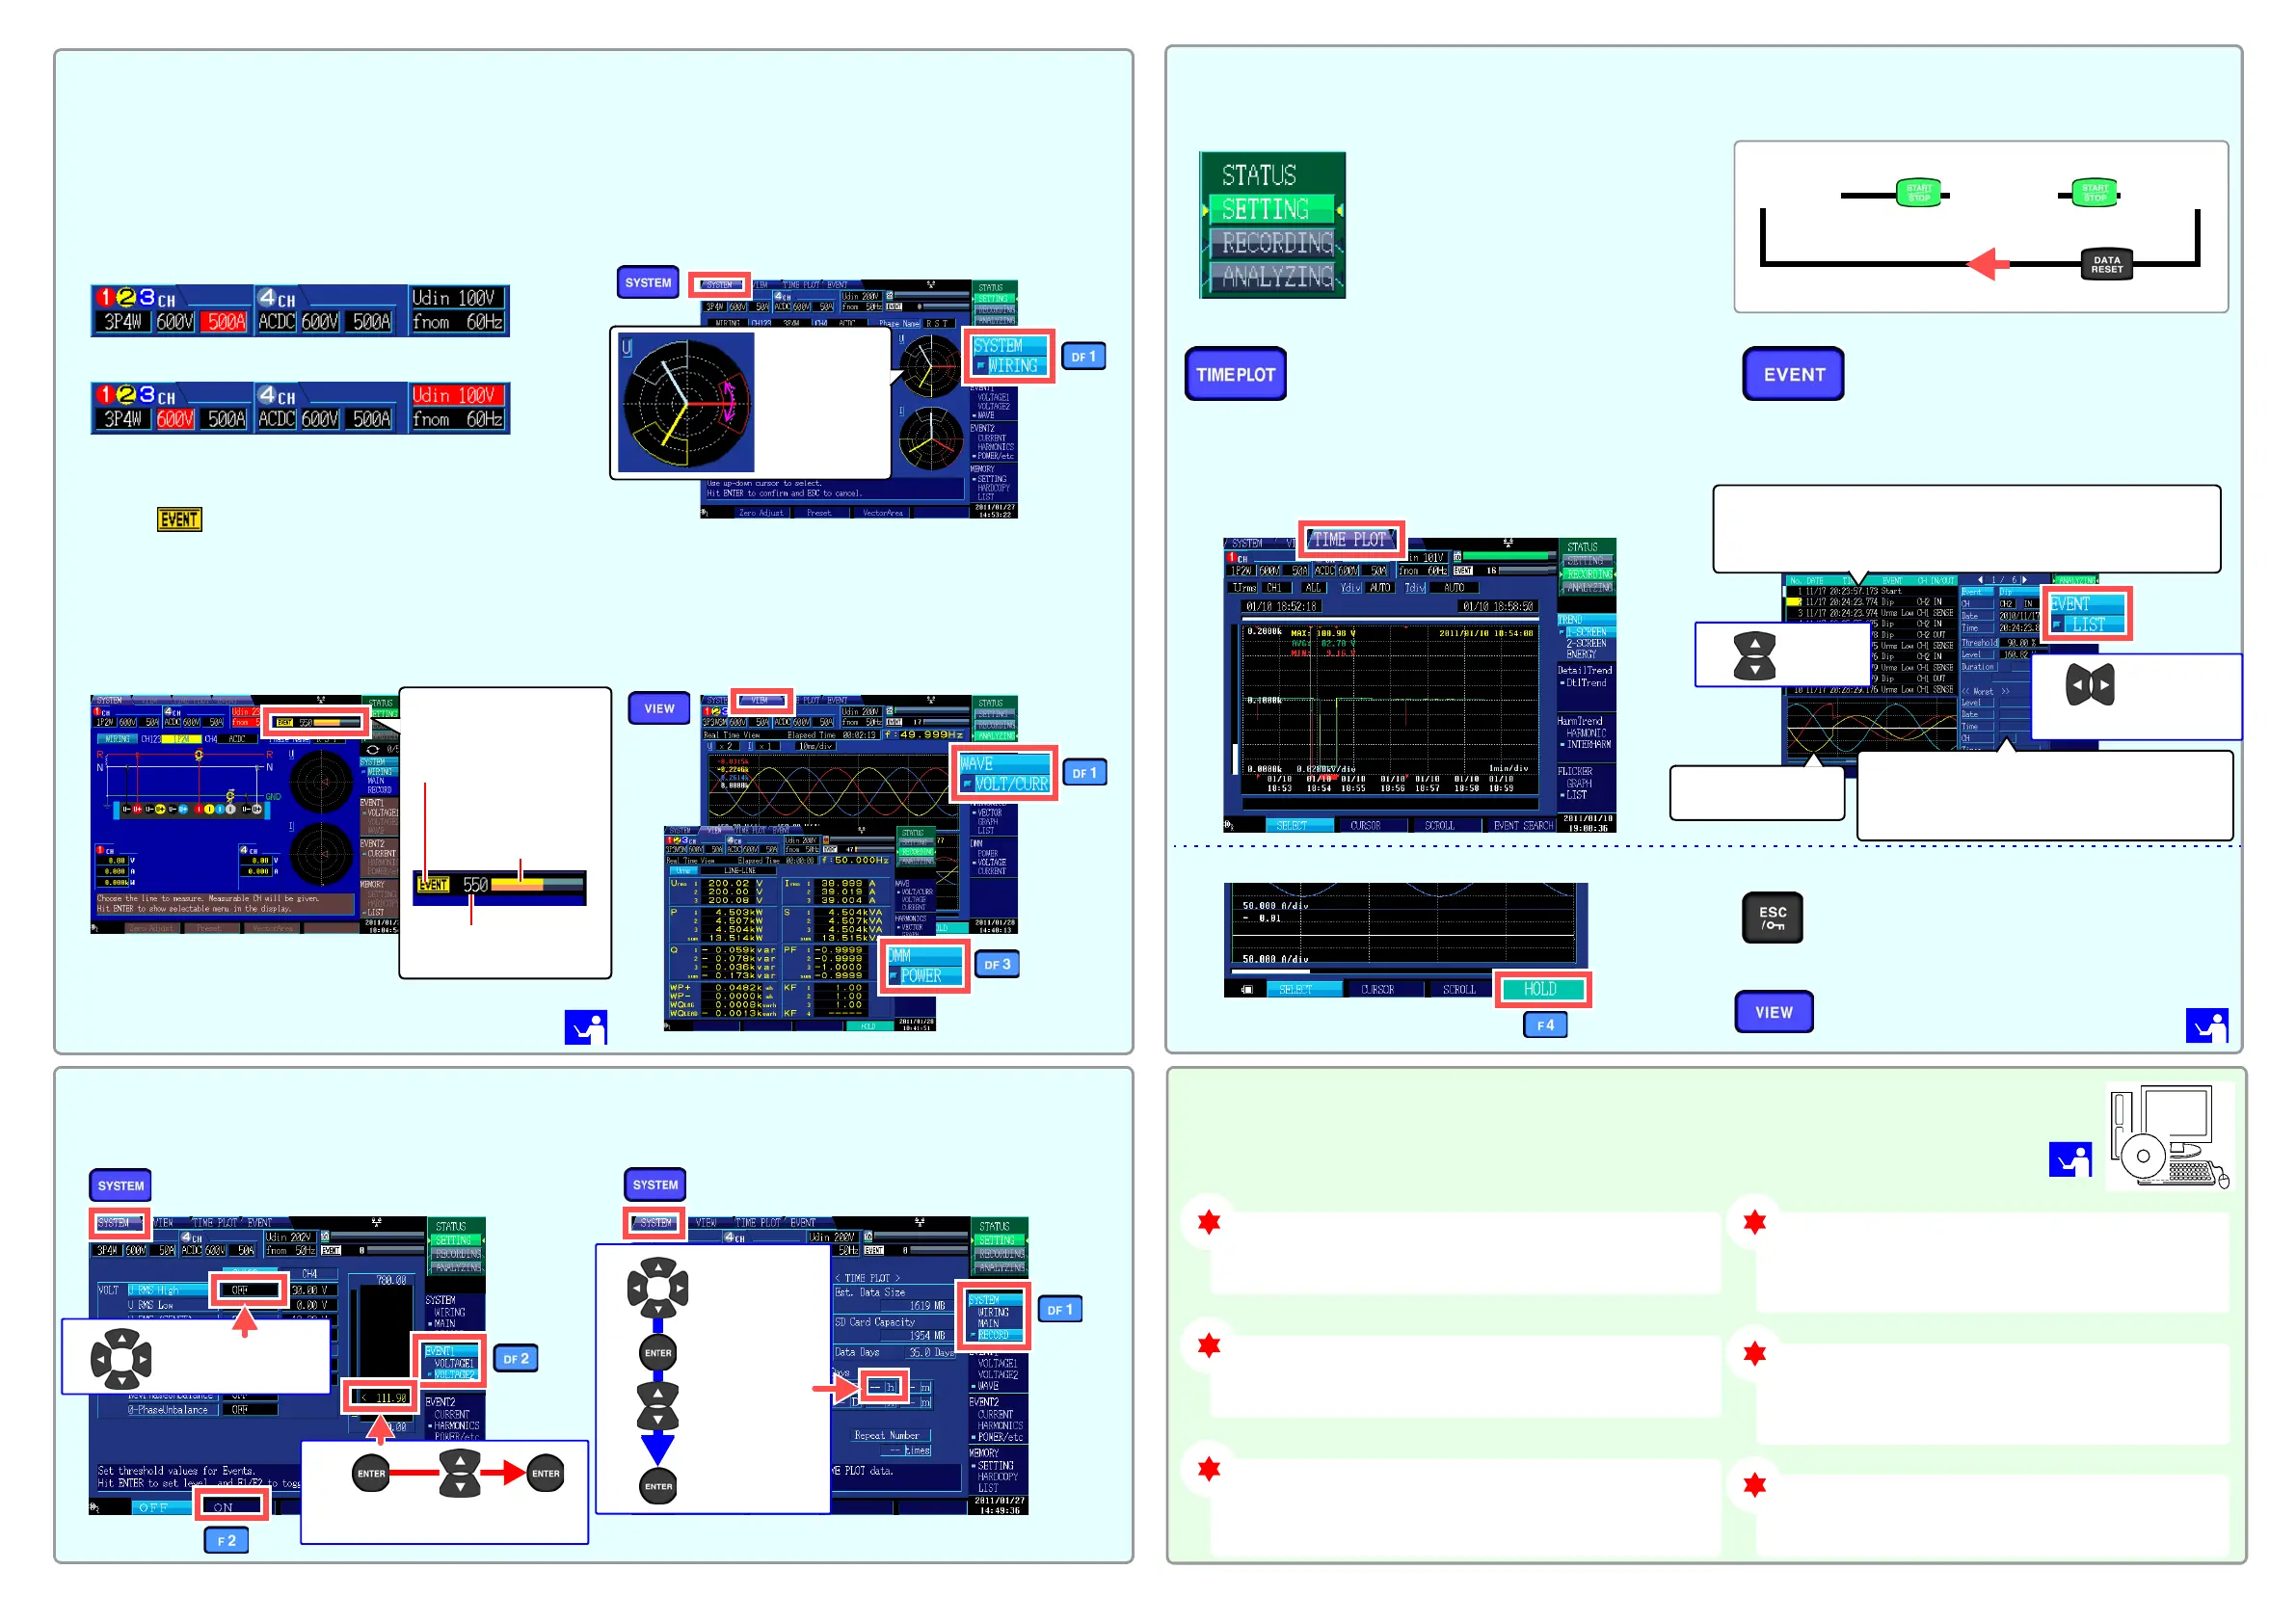
Monitoring fluctuations in
measured values
You can view measured items in the form of a time series
graph. You can also display flicker values as a graph or list.
Press the TIMEPLOT key to display the [TIMEPLOT] screen.
You can change the screen display with the DF keys.
7
Starting recording
Press the START/STOP key to start recording. Data will be
automatically saved to the SD memory card.
• When recording, the operating mode indi-
cator on the top right of the screen will
show [RECORDING].
• To change a setting, set the operating
mode to [SETTING]. (Settings cannot be
changed while recording or analyzing.)
8
Analysis
After recording has stopped, data can be analyzed on a computer
using the optional 9624-50 PQA Hi-View Pro application.
Printing data
You can print individual screens from the instrument. You
can also group all open [TIMEPLOT] screens onto a sin-
gle page for printing.
Converting data
You can convert event data and TIMEPLOT data (binary
data) to text data for use in a spreadsheet such as Excel.
Downloading data
You can download data to a computer via an SD memory
card, USB interface, or LAN interface.
To hold waveforms and values
Push
To active the key lock
For more information, see the 9624-50
PQA Hi-View Pro instruction manual.
Press and hold for at least 3 seconds.
To cancel the key lock, press and hold for
at least 3 seconds again.
Calculating demand and integral power
You can calculate maximum values, average demand
values, and integral power from measurement data.
To check instantaneous values
Push
(Switch screens with the DF key.)
Monitoring event
generation
You can check whether events are occurring and the num-
ber of events occurring with the event list.
Press the EVENT key to display the [EVENT] screen.
Event list
Select an event and press the ENTER key to view waveforms and
measured values at the time of its generation on the [VIEW]
screen.
Event list details
When multiple events occurred at the same
time, “1/N” (where N indicates the total number
of events) is displayed at the top of the list.
Waveforms at event
occurrence
Select
an event
Select an
event from the
event list
details
1
2
Note: HOLD function is valid on the
[VIEW] screen only.

 Loading...


