Statistical Operations
63
Table 10-1 The Statistics Menu Items
Menu Item Description
Sigma Y The sum of the y values.
Sigma X
2
The sum of the squares of the x values.
Sigma Y
2
The sum of the squares for the y values.
Sigma XY The sum of the products of the x and y values.
Statistics Example
Sales for the last five months are represented by the pairs of values shown below, with the month number as x, and the
sales values as y. Enter these into the Data menu. Using the Statistics menu for Predictions, predict sales for month
seven. What is the linear regression line? What is the sum of all the y values? See Tables 10-2 and 10-3.
Table 10-2 Months and Sales
Month Sales Values
1 150
2 165
3 160
4 175
5 170
Table 10-3 Statistics Example
Keys Display Description
:y
Opens Data menu.
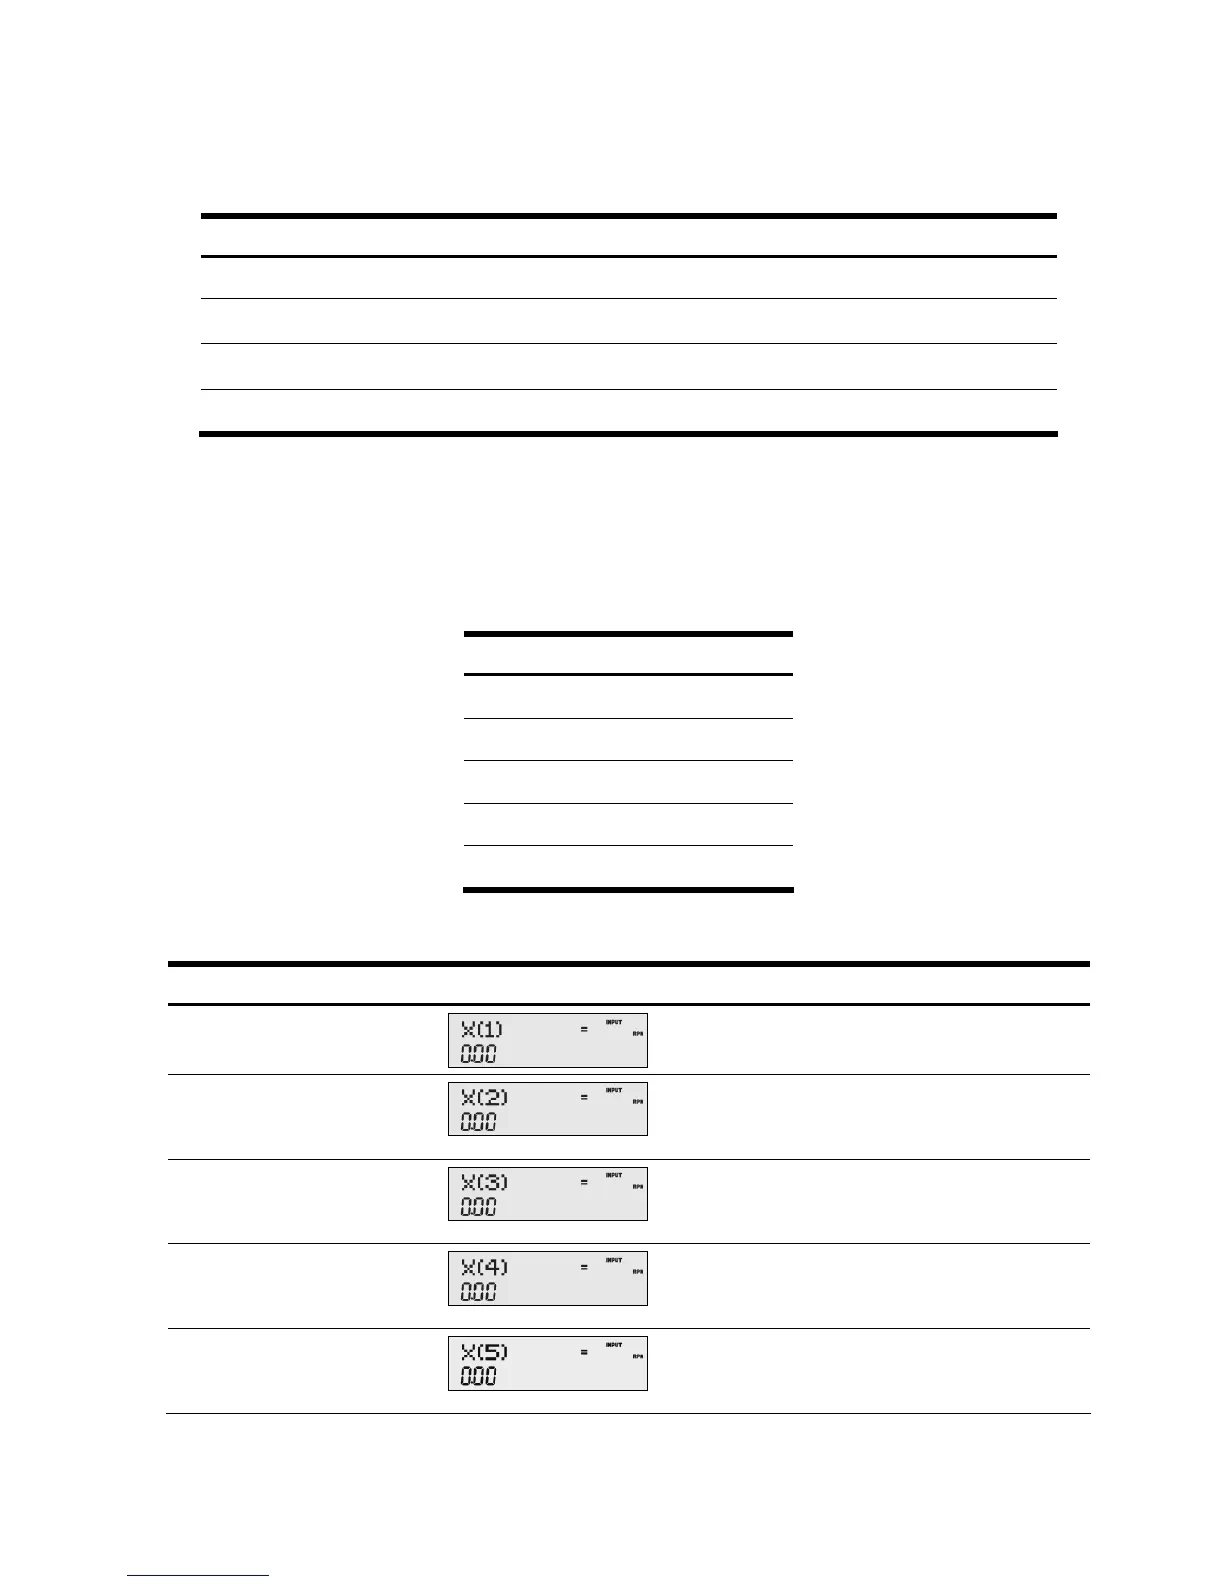
1I1
50I
Inputs values for X(1) and Y(1).
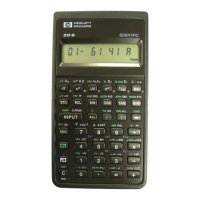
2I1
65I
Inputs values for X(2) and Y(2).
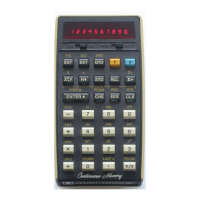
3I1
60I
Inputs values for X(3) and Y(3).
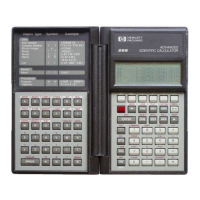
4I1
75I
Inputs values for X(4) and Y(4).