Getting Started 27
pressing 1Ï2/4Ï5/9Ï4/.
To view the results of the linear regression, press ¹% to
view the linear regression menu.
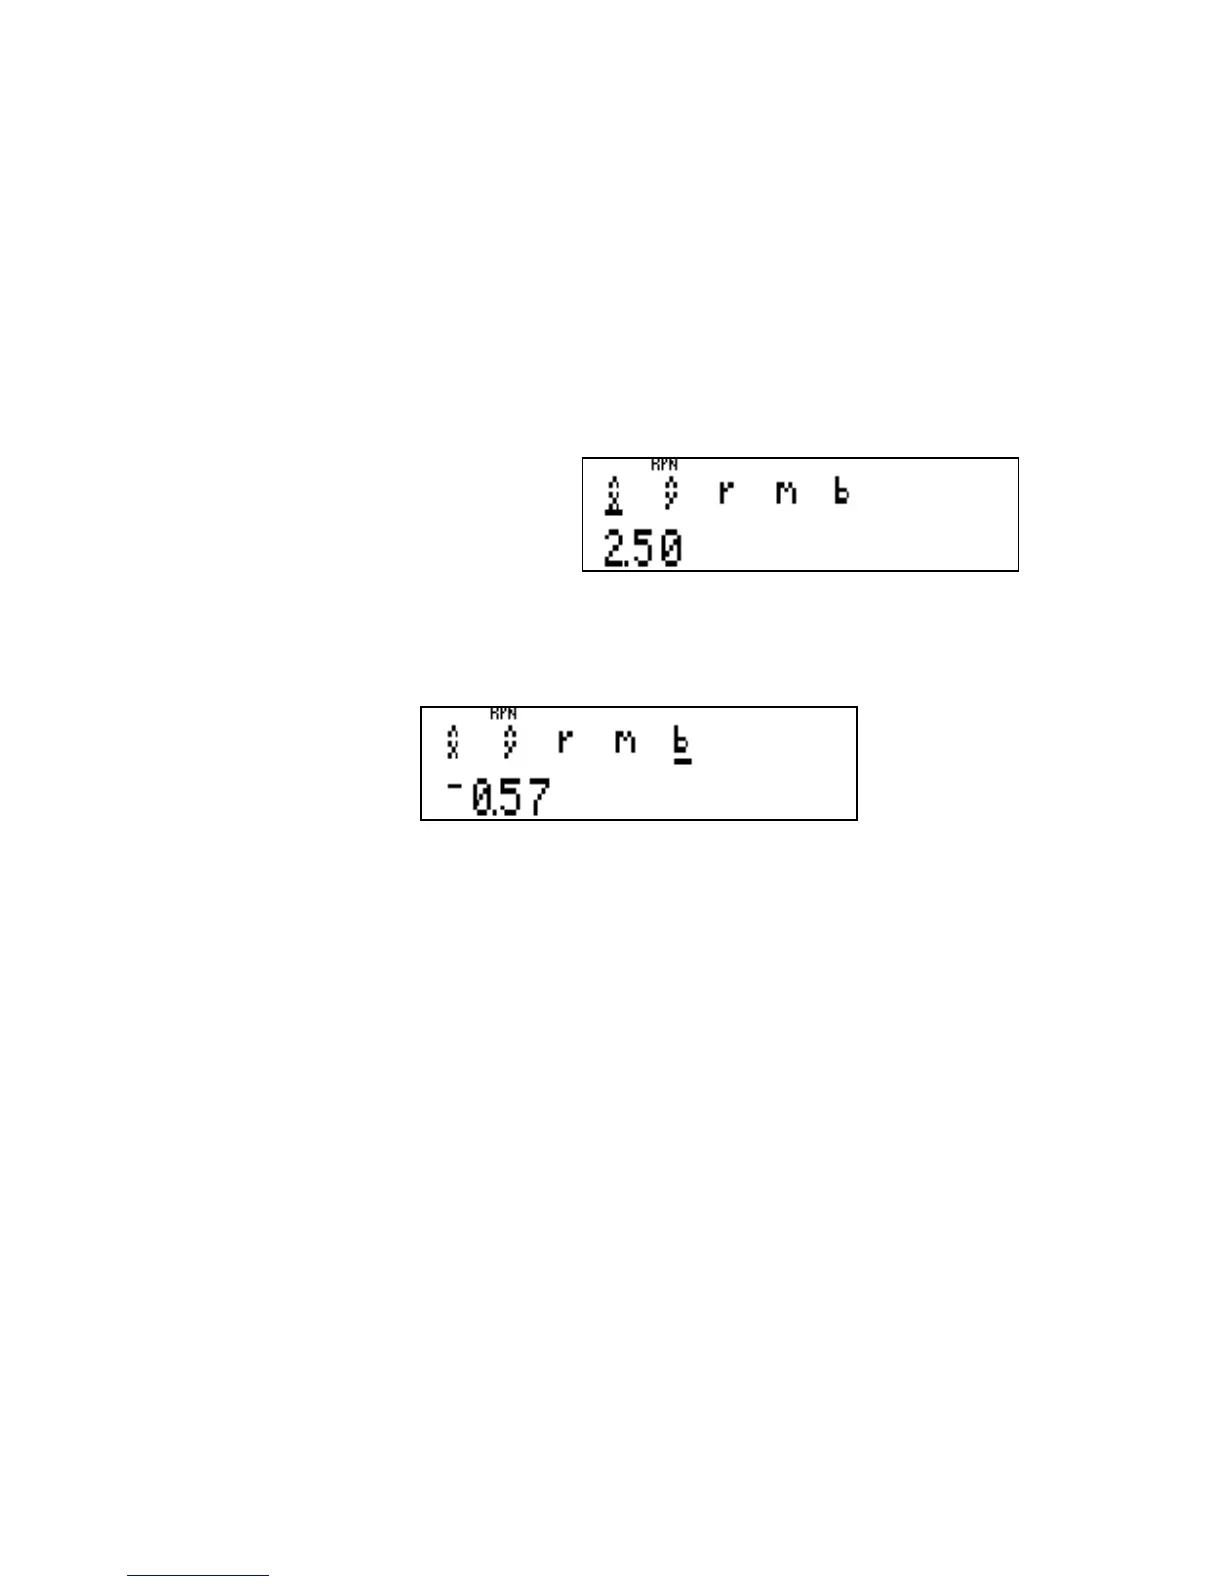
To estimate X and Y values using the linear regression equation,
enter the known value, then enter the linear regression menu to
view the estimated value. In this example, to estimate a Y value
The first menu entries
are used to estimate an
X value given a value
of Y, and a Y value
given a value of X.
Figure 16
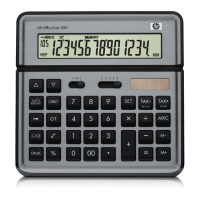
Figure 17
The third entry on the menu displays the correlation coefficient,
r. The next two entries on the menu display the slope and
Y–intercept of the line that best fits the data points. To view the
slope, press ÕÕÕ to move the cursor under the m sym-
bol in the menu. The slope is 1.43. Press Õ to view the
Y–intercept, which is –0.57.