26 Getting Started
To view the average Y value, press Õ to move the cursor over
one space to the right. The average of the Y values is 4.67.
Note: the keystrokes are the same in both ALG and RPN modes.
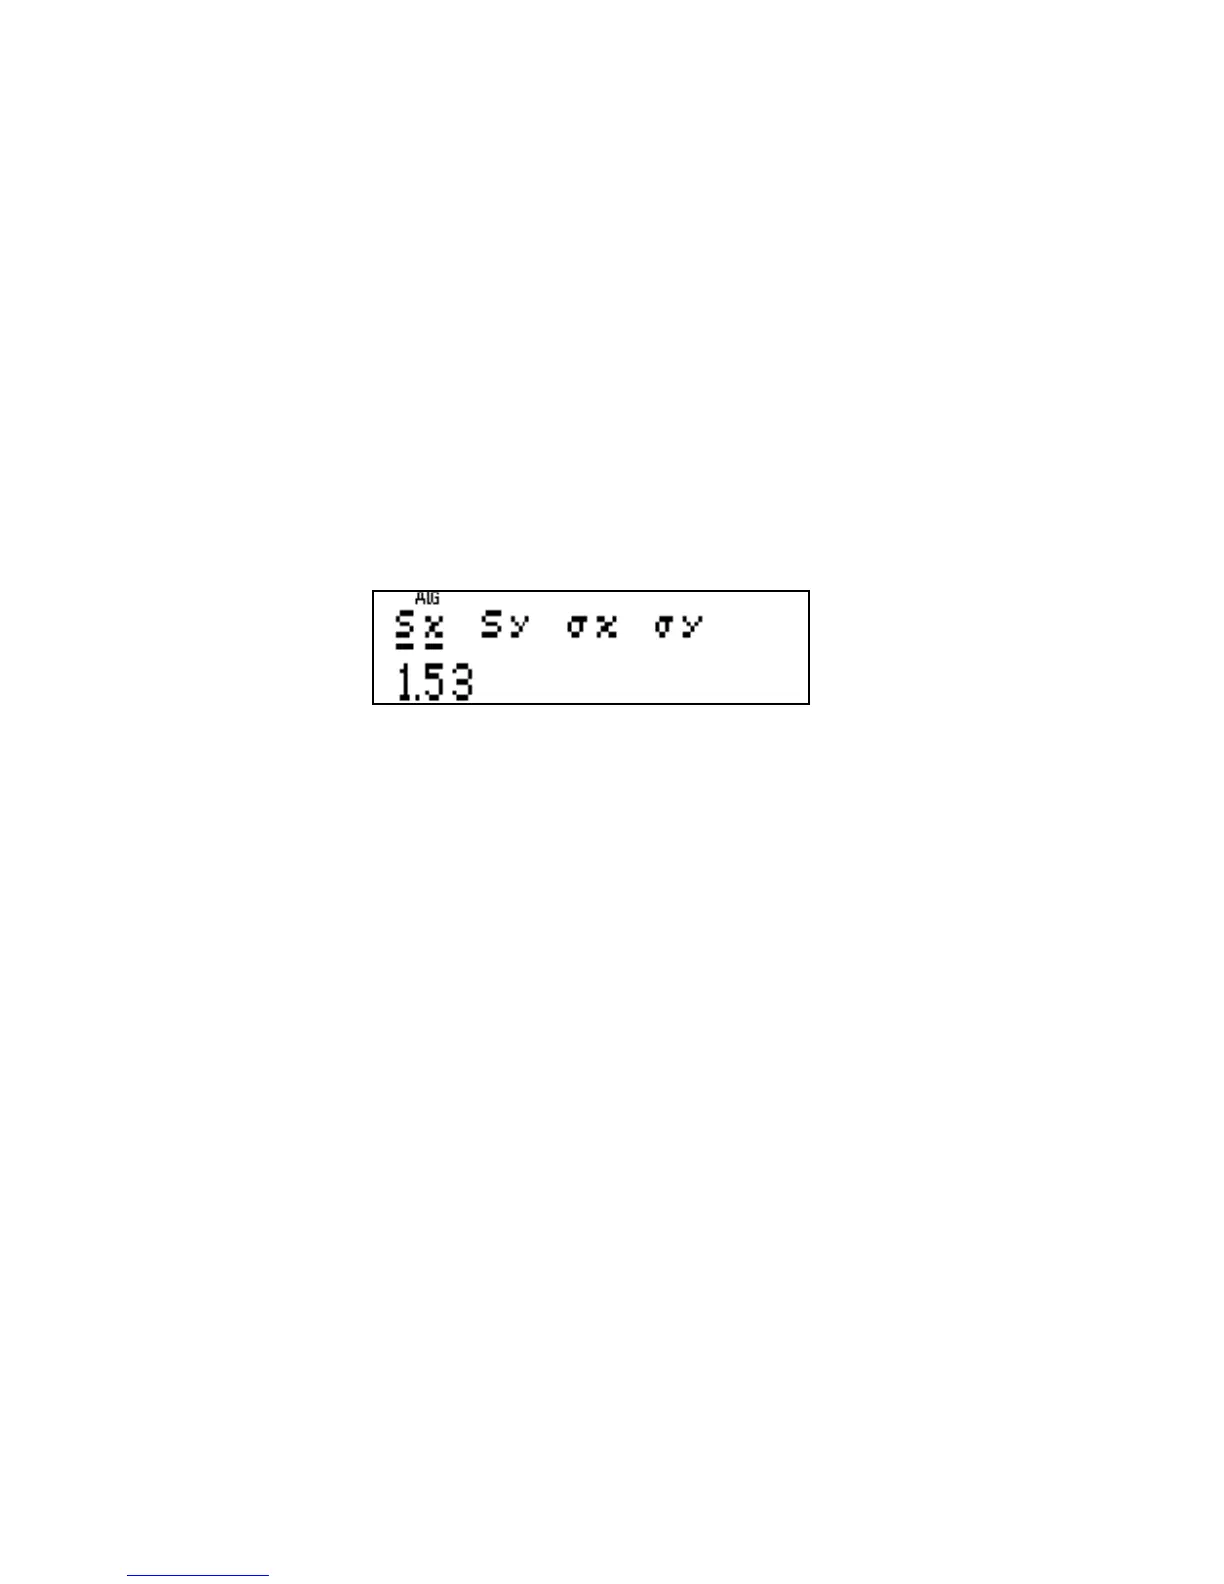
To view the standard deviation of the X and Y values, press
º+ to view the standard deviation menu. The first two items
are the sample standard deviations of X and Y. The next two
items are the population standard deviations of X and Y.
Figure 15
To use a value from either menu in a calculation, press Ï
when it is displayed. Calculate values for one–variable data in
the same way. For example, to calculate the average of 1, 4,
and 9, press º¡4 then 1/4/9/, followed
by ¹( in either mode.
Linear Regression
The HP 35s can estimate the equation of a straight line that best
fits a set of (x,y) real number data points. For example, suppose
you wish to fit a straight line to these data points: (1,2), (4,5),
and (9,4). These data points are entered the same way as statis-
tical data. First, clear the statistical data registers by pressing
º¡4. Then in RPN mode, enter the data points by
 Loading...


