94 Statistics 2Var app
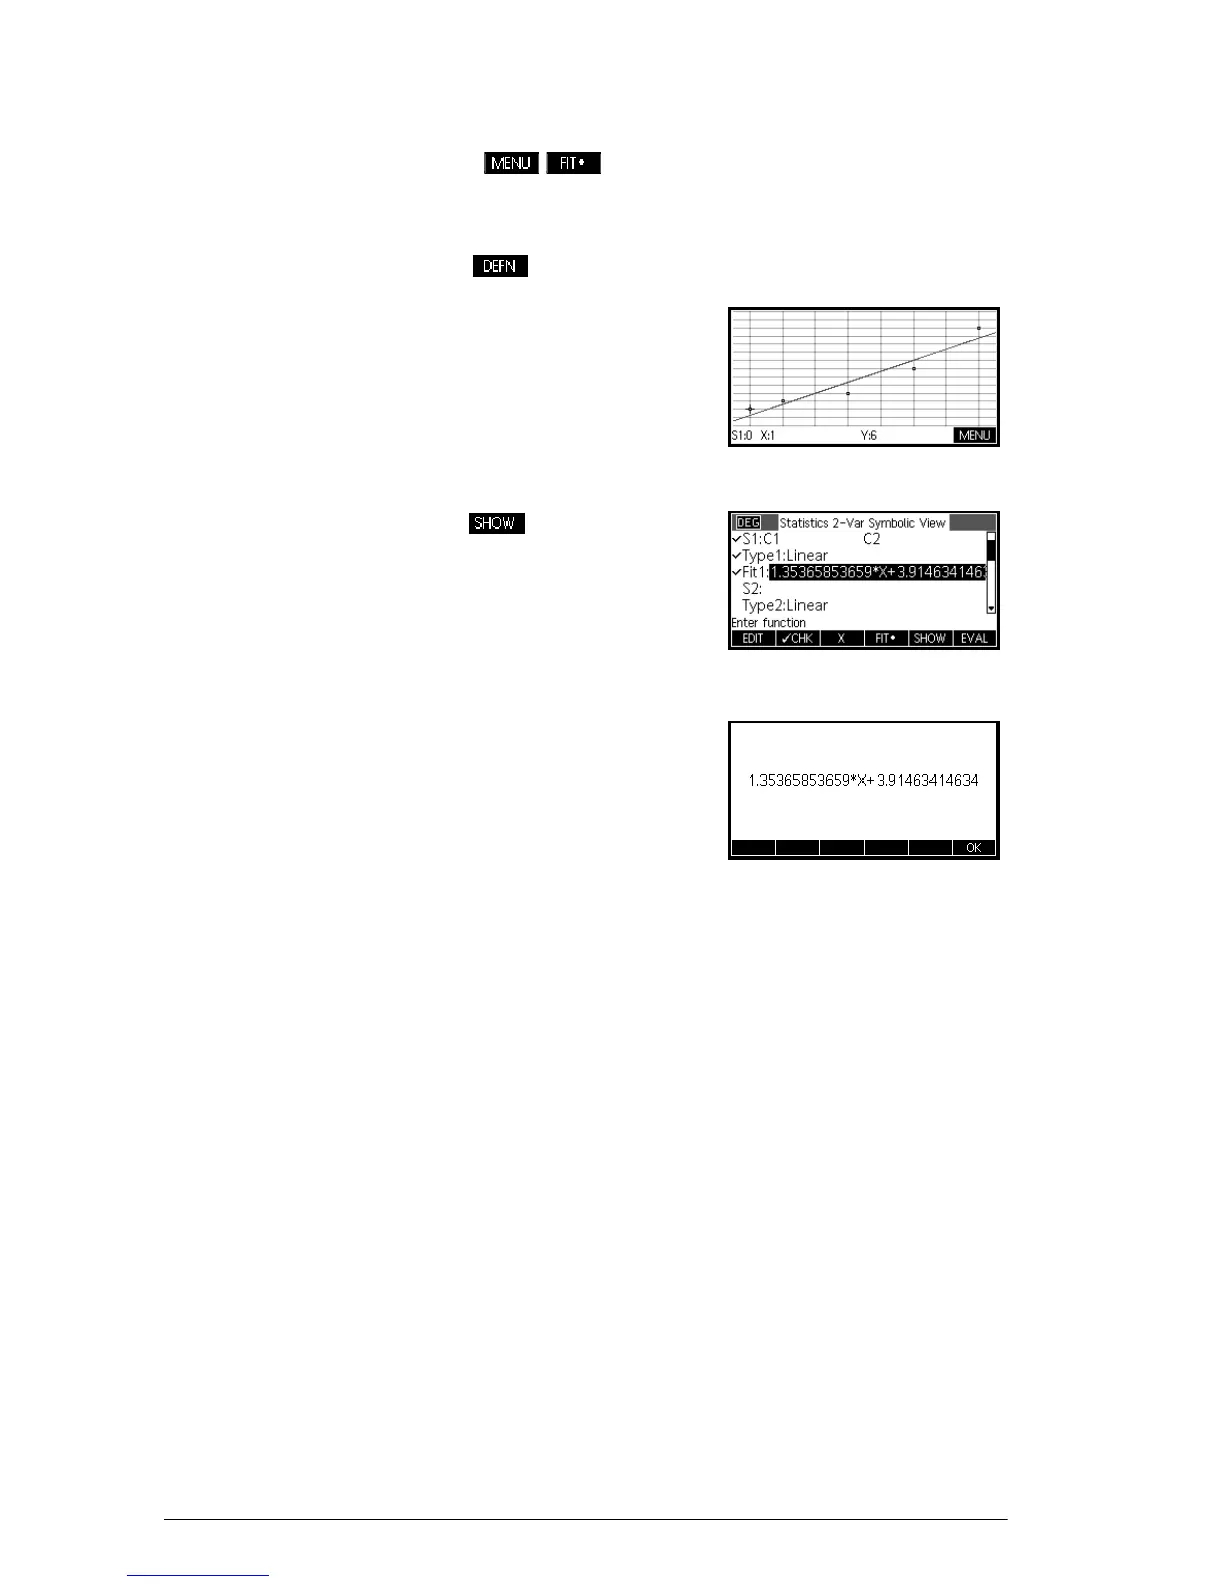
Fitting a curve Press . The graph of the fit will be displayed
with the scatter plot. Press
\to move the tracer to the
graph of the fit. Press
> and < to trace along the fit
and to see the equation of the fit.
PressYto see the
equation of the fit in the
Fit1 field. To see the full
equation, highlight the fit
equation and press
The expression in Fit2
shows the slope
(m=1.98082191781) and
the y-intercept
(b=2.26575).