Statistics 1Var app 75
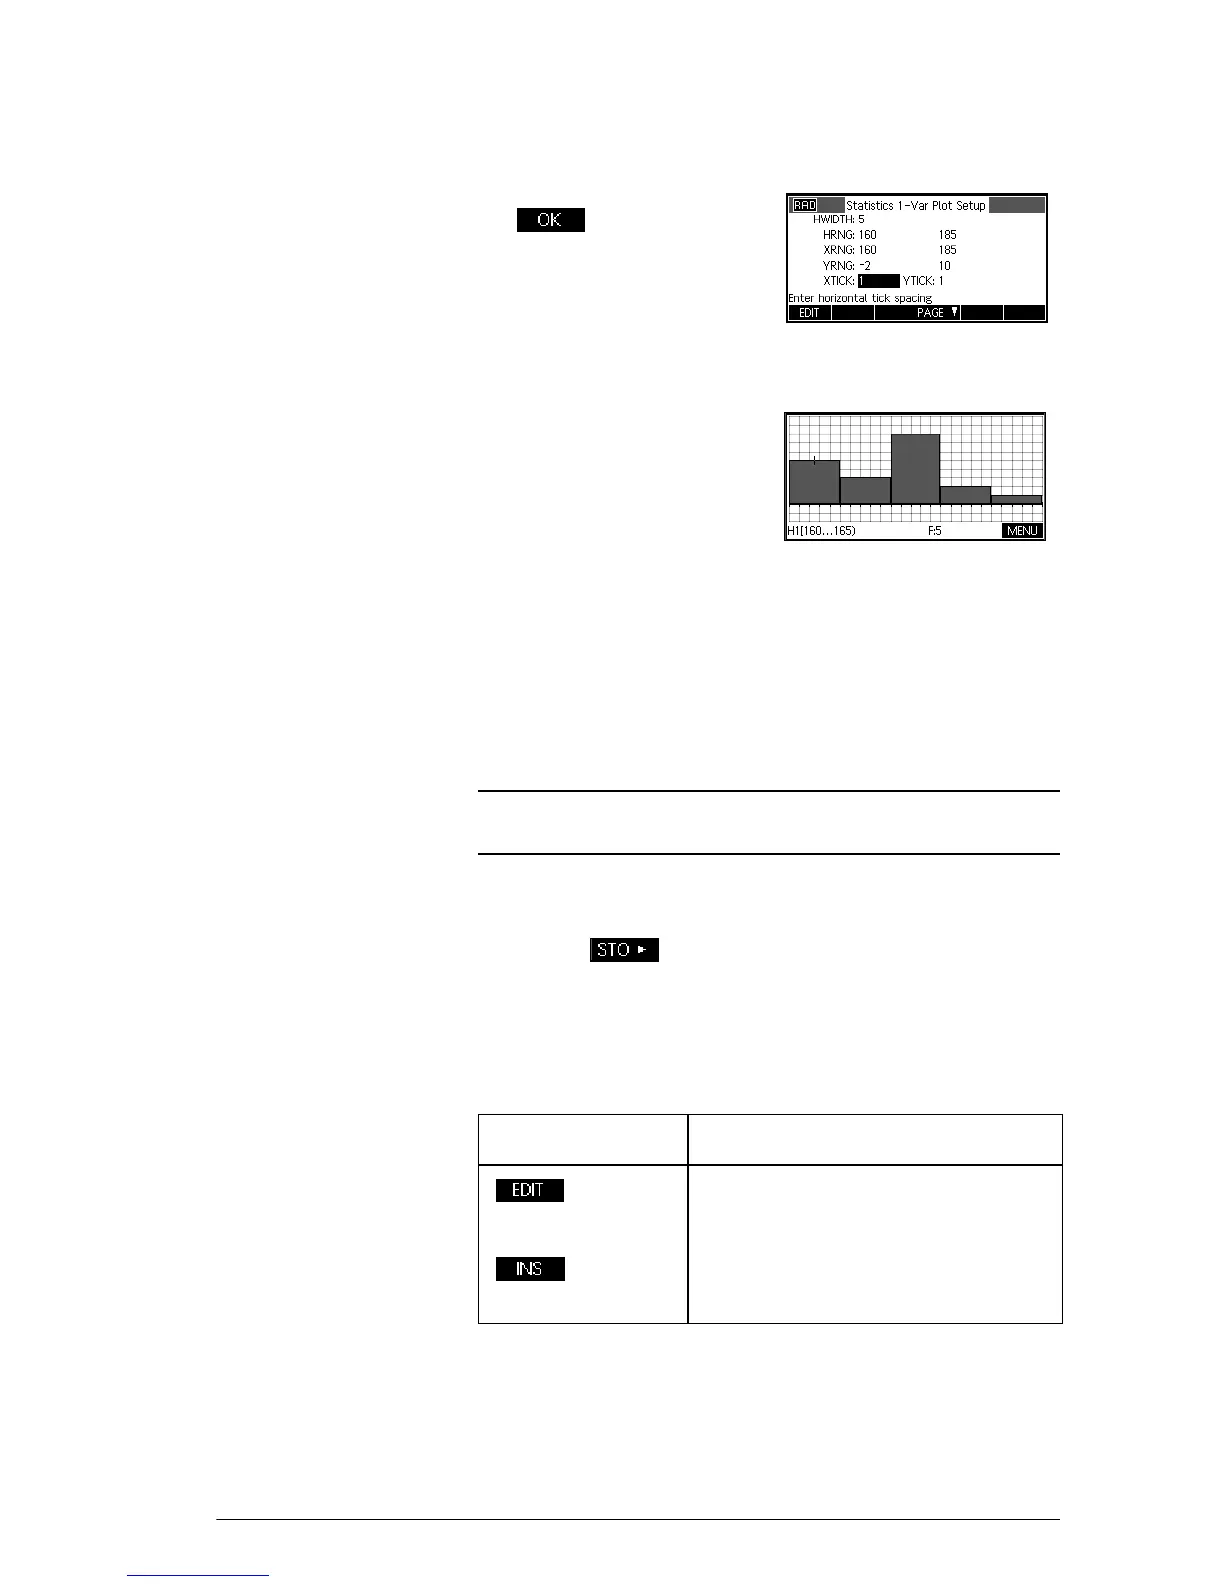
9. Setup a histogram plot for the data.
S
SETUP-
PLOT
Enter set up information
appropriate to your
data.
10. Plot a histogram of the
data.
P
Entering and editing statistical data
The Numeric view (
M
) is used to enter data into the
Statistics 1Var app. Each column represents a variable
named D0 to D9. After entering the data, you must define
the data set in the Symbolic view (
Y
).
HINT
A data column must have at least two data points for one-
variable statistics.
You can also store statistical data values by copying lists
from Home into statistics data columns. For example, in
Home, L1 D1 stores a copy of the list L1 into the
data-column variable D1.
Statistics 1Var app’s Num View keys
The Statistics 1Var app’s Numeric view keys are:
Key Meaning
Copies the highlighted item into
the edit line.
Inserts a zero value above the
highlighted cell.