74 Statistics 1Var app
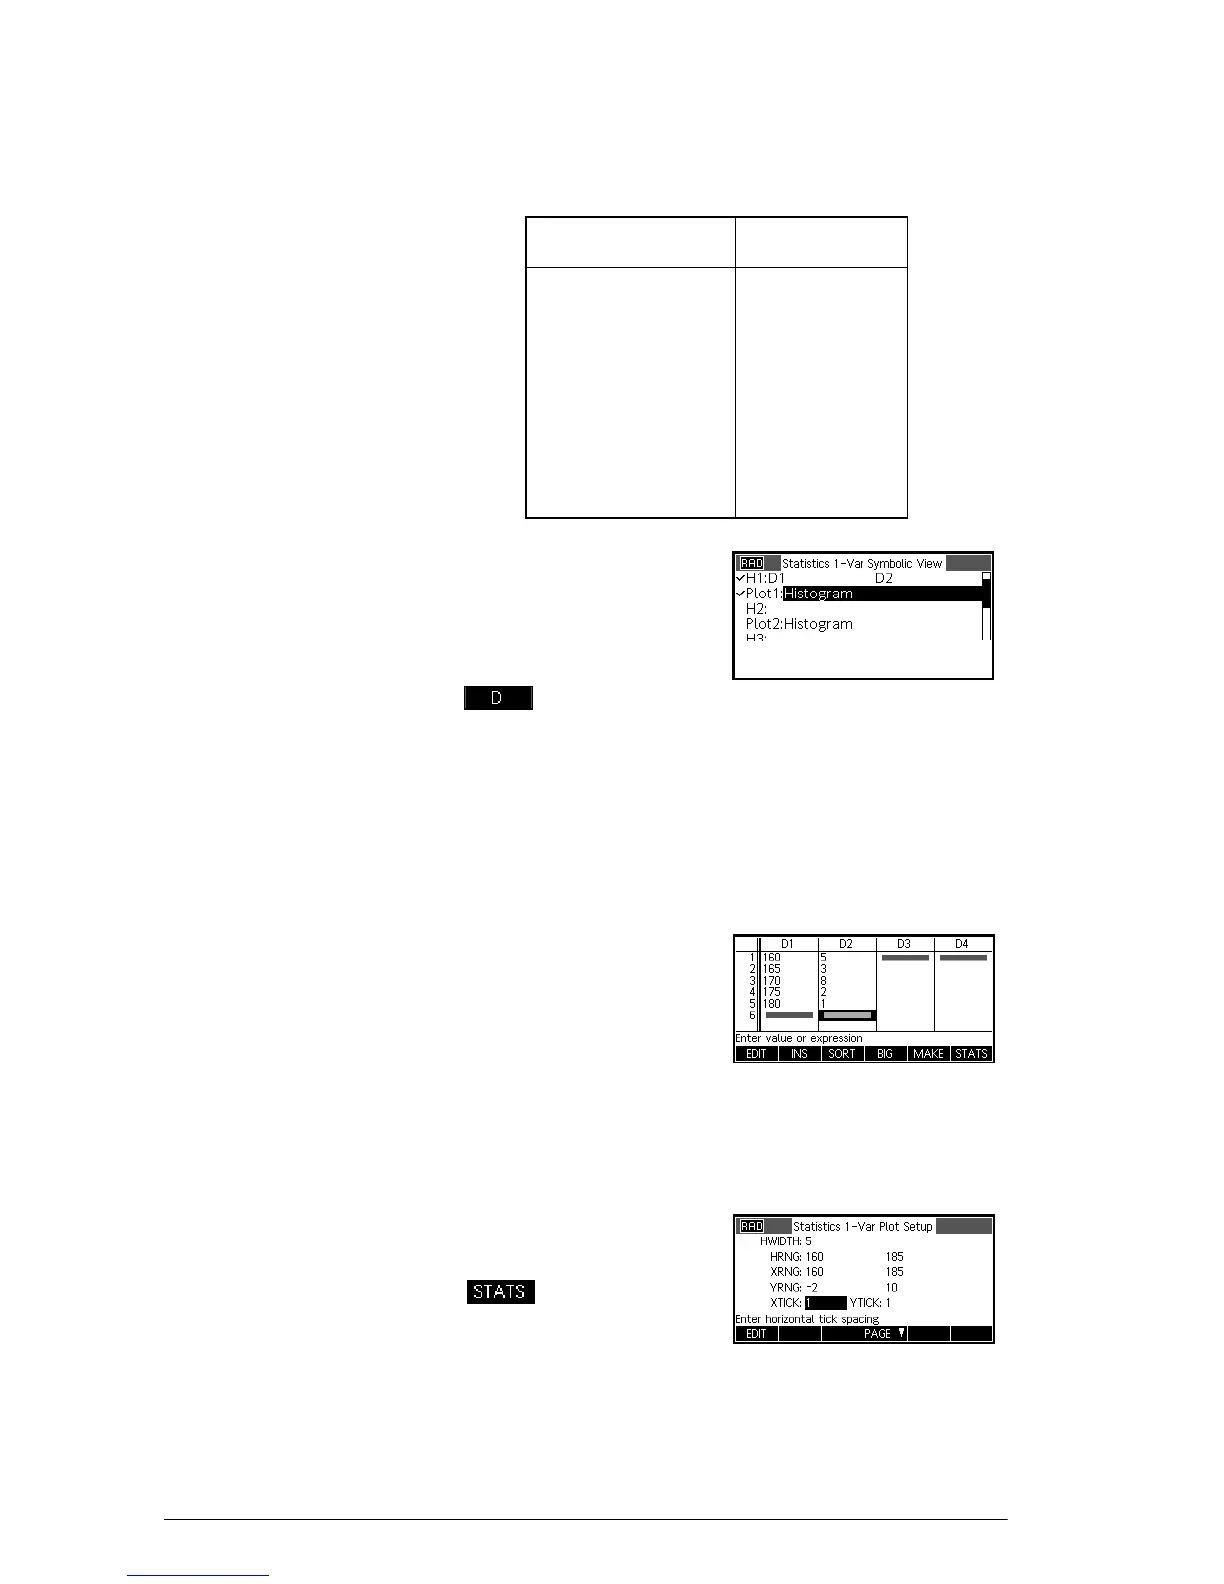
shall simply add another column, D2, that holds the
frequencies of our five data points in D1.
5. Move the highlight bar
into the right column of
the H1 definition and
enter the column
variable name D2.
2
6. Return to the numeric view.
M
7. Enter the frequency data shown in the above table.
>5E3E
8E
2E
1E
8. Display the computed
statistics.
The mean height is
approximately
167.63cm.
Height (cm) Frequency
160 5
165 3
170 8
175 2
180 1