Parametric app 121
Plot the
expression
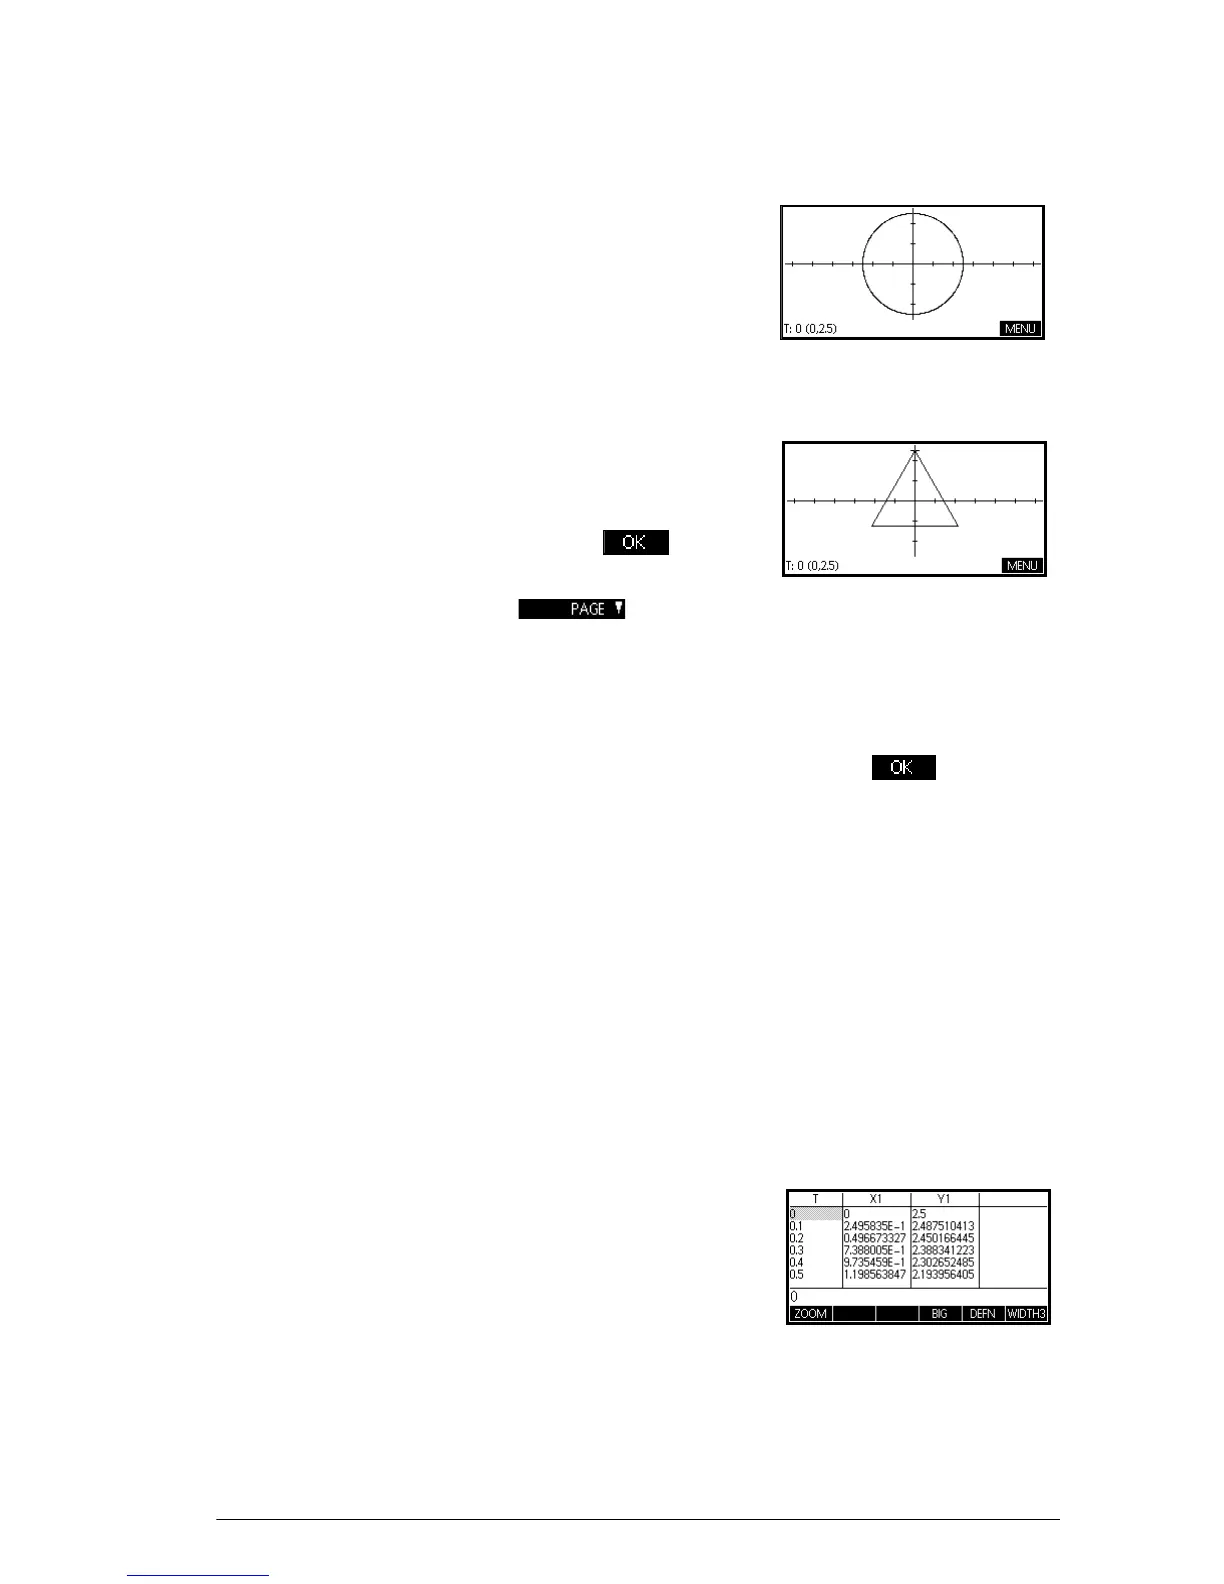
6. Plot the expression.
P
Explore the
graph
7. Plot a triangle instead of a circle.
SP
\
120
\\
\
Select Fixed-Step Segments
P
A triangle is displayed rather than a circle (without
changing the equation) because the changed value
of TSTEP ensures that points being plotted are 120°
apart instead of nearly continuous, and selecting
Fixed-Step Segments connects the points 120°
apart with line segments.
You are able to explore the graph using the trace,
zoom, split screen, and scaling functionality available
in the Function app.
Display the
numeric view
8. Display the Numeric view.
M
9. With a t-value selected, type in a replacement value,
and see the table jump to that value. You can also
zoom in or zoom out on any t-value in the table. You
are able to explore the table using the zoom, build

 Loading...


