72 Statistics 1Var app
160 E
165 E
170 E
175 E
180 E
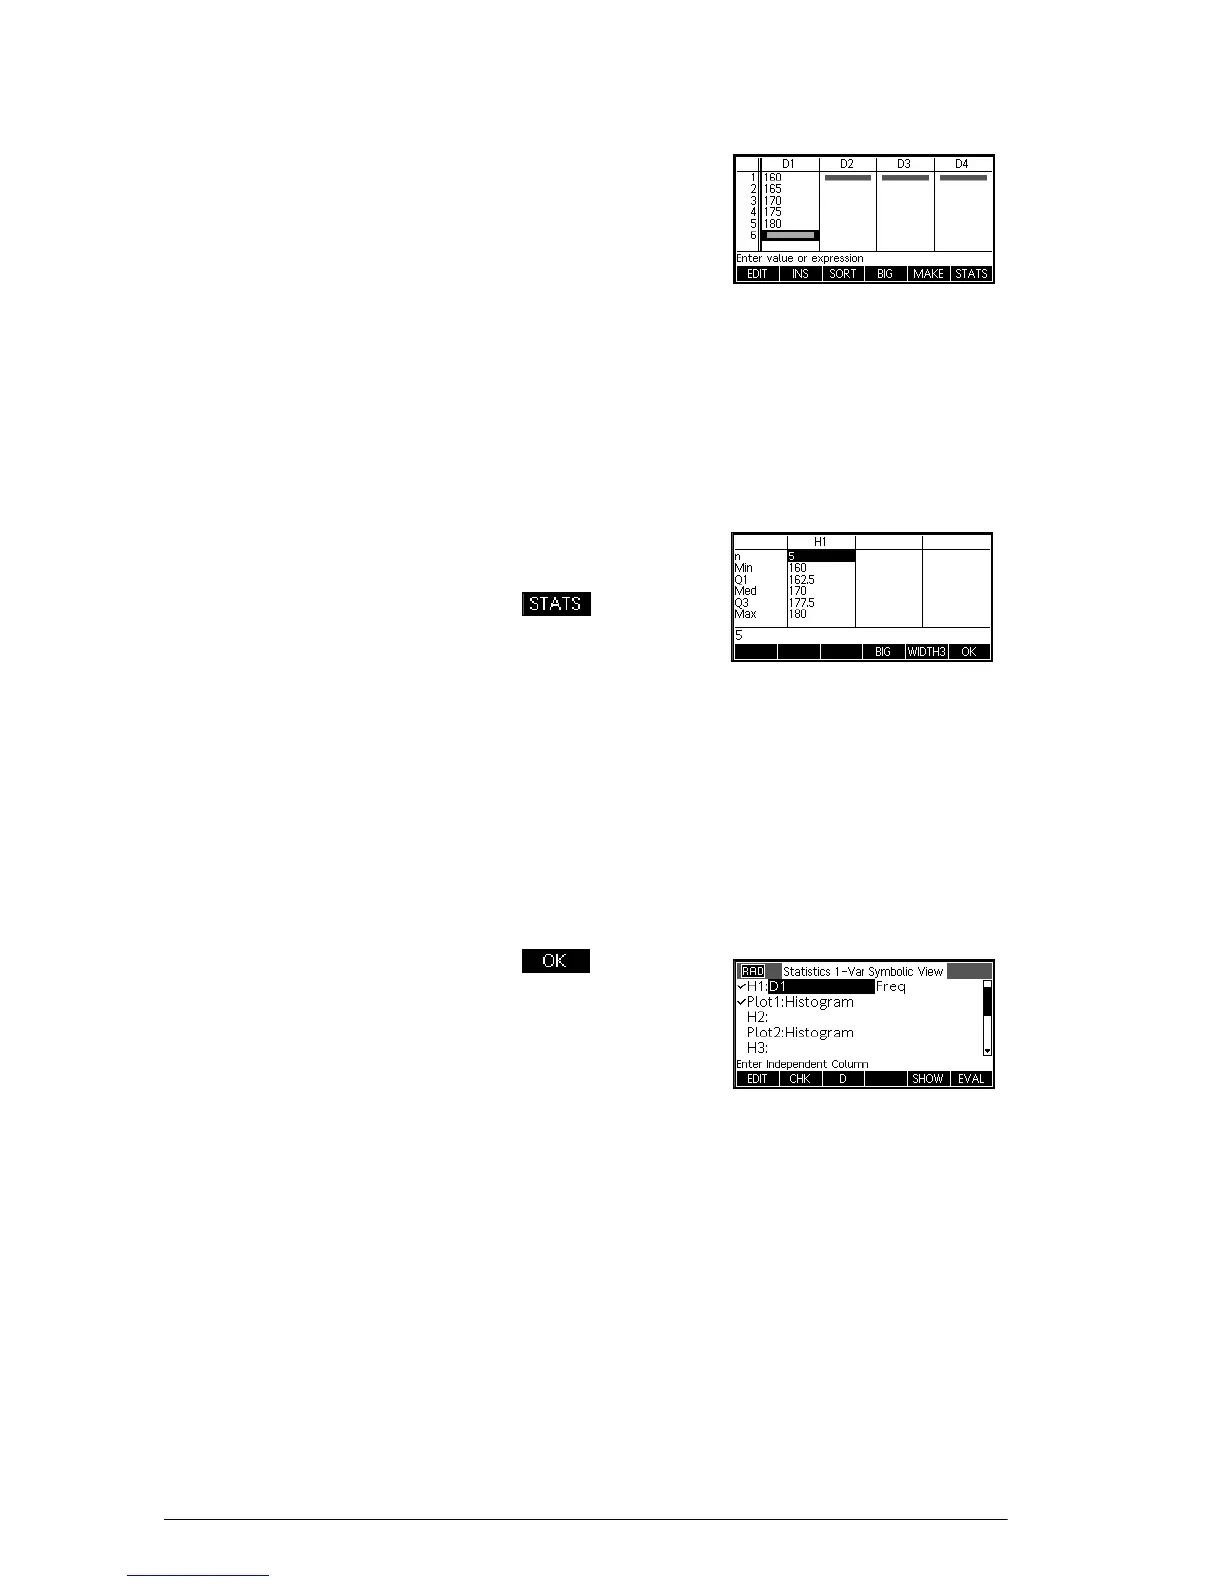
3. Find the mean of the
sample.
Press to see the
statistics calculated
from the sample data in
D1.
Note that the title of the column of statistics is H1.
There are 5 data set definitions available for one-
variable statistics: H1–H5. If data is entered in D1, H1
is automatically set to use D1 for data, and the
frequency of each data point is set to 1. You can
select other columns of data from the Symbolic view
of the app.
4. Press to close
the statistics window.
Press
Yto see the
data set definitions.
The first column indicates the associated column of
data for each data set definition, and the second
column indicates the constant frequency, or the
column that holds the frequencies.