Model 5328A
Operation
B
INPUT
&325
ns-L
I
INTERVAL MEASURED
I
I
I
!
ov
I
A MARKER
I
-100 mV
I
J
'
ov
B
MARKER -100 mV
OPTION 040
I
ov
T.I.A--B -50 mV
MARKER
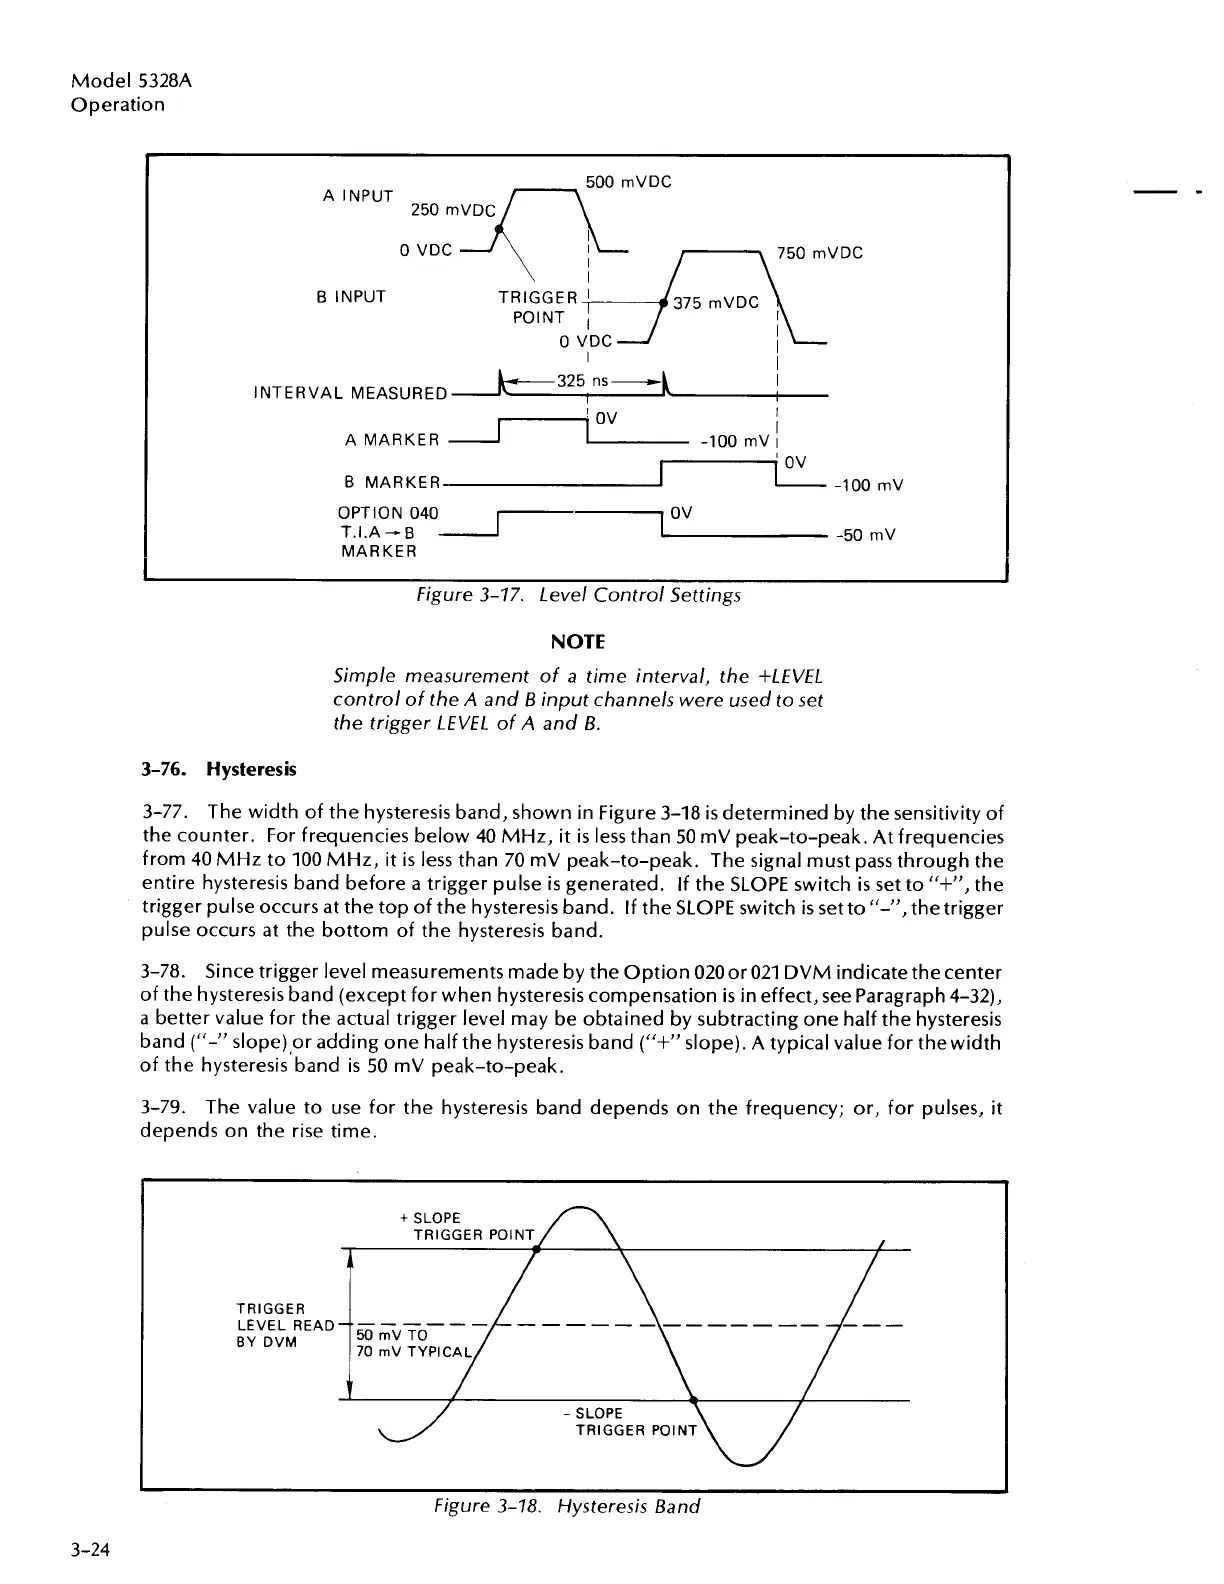
Figure 3-17. Level Control Settings
NOTE
Simple measurement of
a
time interval, the +LEVEL
control of the
A
and B input channels were used to set
the trigger LEVEL of
A
and
6.
3-76. Hysteresis
3-77. The width of the hysteresis band, shown in Figure 3-18
is
determined by the sensitivity of
the counter. For frequencies below 40 MHz,
it
is less than 50 mV peak-to-peak. At frequencies
from 40 MHz to 100 MHz, it is less than 70 mV peak-to-peak. The signal must pass through the
entire hysteresis band before a trigger pulse
is
generated.
If
the SLOPE switch
is
set to
"+",
the
trigger pulse occurs at the top of the hysteresis band.
If
the SLOPE switch
is
set to "-",the trigger
pulse occurs at the bottom of the hysteresis band.
3-78. Since trigger level measurements made by the Option 020or021 DVM indicatethecenter
of the hysteresis band (except for when hysteresis compensation
is
in effect, see Paragraph 4-32),
a
better value for the actual trigger level may be obtained by subtracting one half the hysteresis
band
("-"
slope) or adding one half the hysteresis band
("+"
slope). A typical value for thewidth
of the hysteresiscband is 50 mV peak-to-peak.
3-79. The value to use for the hysteresis band depends on the frequency; or, for pulses, it
depends on the rise time.
TRIGGER
LEVEL READ
BY
DVM
+
SLOPE
Figure 3-18. Hysteresis Band
Artisan Technology Group - Quality Instrumentation ... Guaranteed | (888) 88-SOURCE | www.artisantg.com