21
21
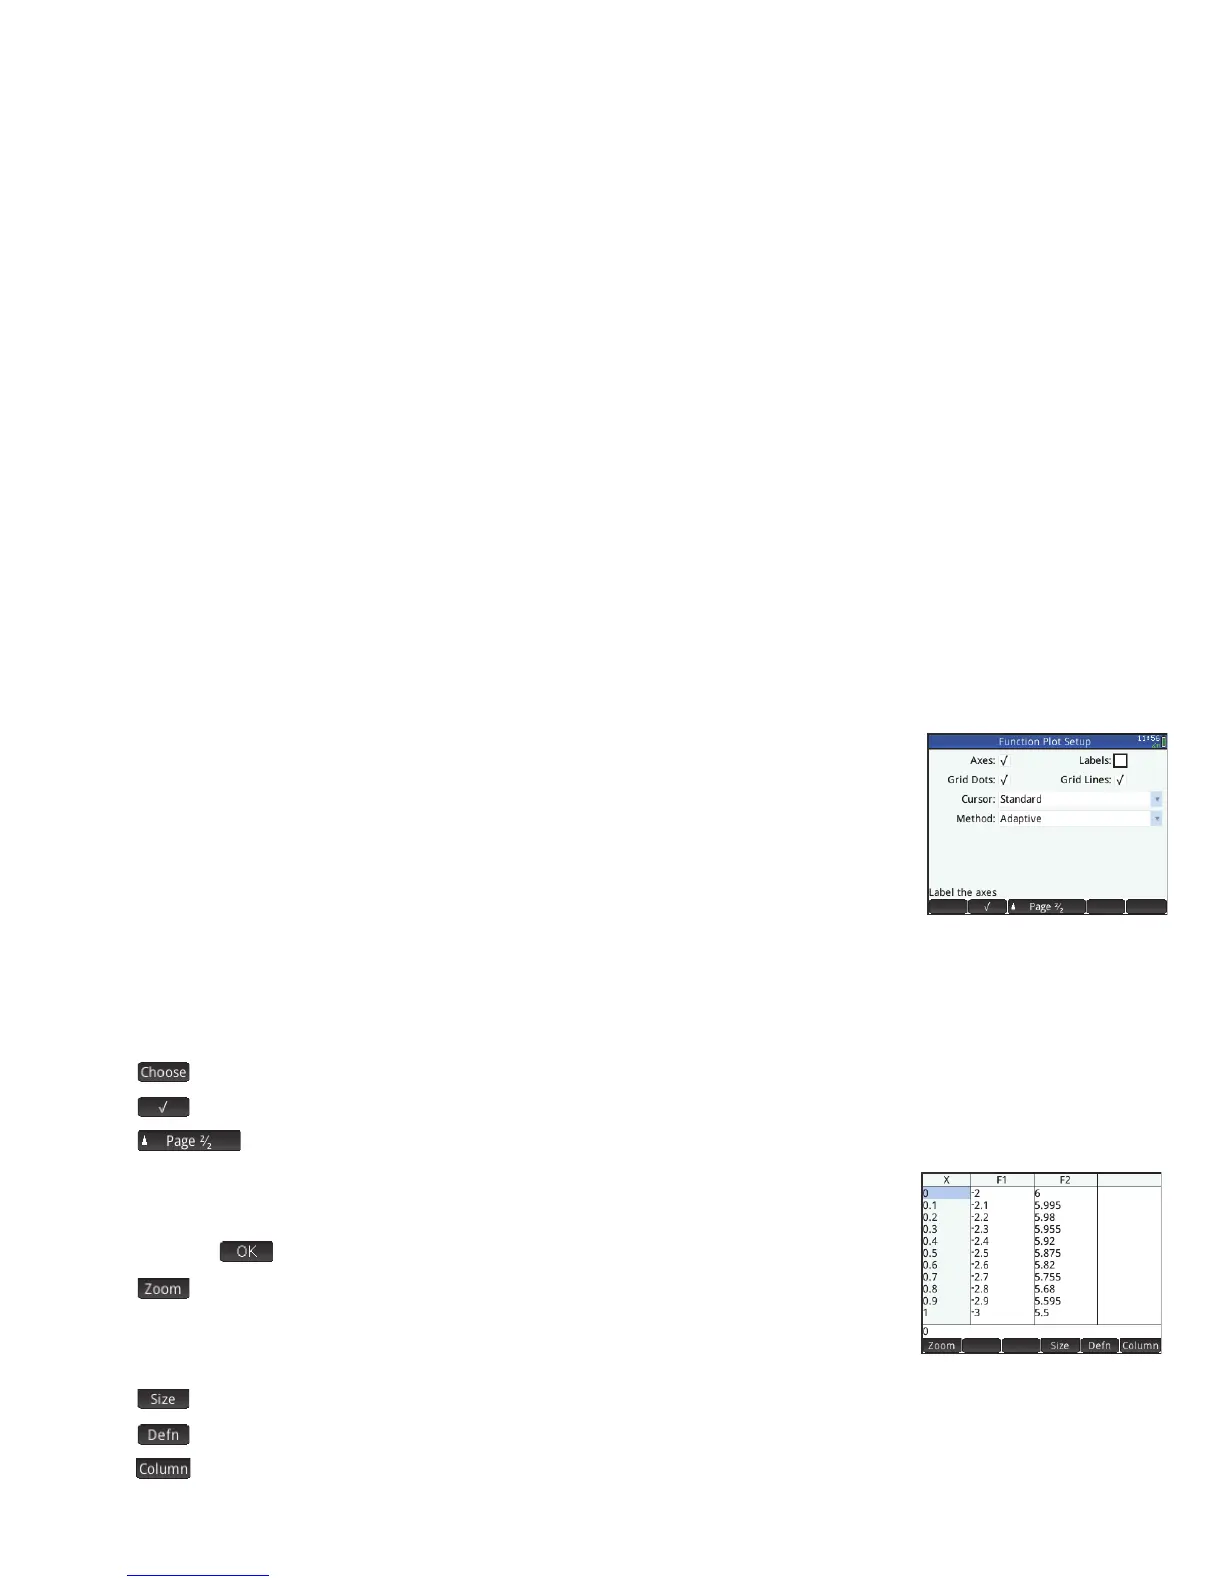
The second page of the Plot Setup view provides the following options:
• Axes: shows or hides the axes
• Labels: shows or hides the axis labels (that is, the values of X Rng and Y Rng at the end of
the axes)
• Grid Dots: shows or hides grid dots
• Grid Lines: shows or hides grid lines
• Cursor: selects the standard, inverting, or blinking cursor
• Method: lets you choose between adaptive, fixed-step segments, and fixed-step dots methods of graphing (explained on
page 17 )
The menu items in this view—which vary according to where your cursor is—are:
• : displays a menu of options. (Displayed only if the selected field offers a menu of options.)
• : toggles the current setting on or off
• : returns you to the first page of the Plot Setup view
Numeric View Press M to display the Numeric view. This view displays in tabular form the
values generated by the functions selected in Symbolic view. Choose any cell in the independent
variable column (labeled X in the example at the right), enter any real value, and then press
E or tap . All values are immediately recalculated. The menu items are:
• : zooms in or out on a highlighted row of the table. Note that in Numeric view,
zooming does not affect the size of what is displayed. Instead, it changes the increment
between consecutive x-values. Zooming in decreases the increment; zooming out increases
the increment. The values in the row you zoom in or out on remain the same.
• : displays a menu for you to choose the small font, medium font, or large font
• : displays the definition of the selected column
• : displays a menu for you to choose how many functions to display: 1,2, 3, or 4
 Loading...