40
40
Tap to see the confidence interval or hypothesis test
results and to return to the Numeric view.
Press P to display the Plot view. This view displays the test
results or confidence interval graphically.
Tap to display the critical score against the test score.
Press \ or = to decrease or increase the -level.
DataStreamer App
The DataStreamer app enables you to collect real-world data from scientific sensors. It works with the HP StreamSmart 410 data
streamer and many of the scientific sensors available from Fourier Systems™. You could, for example, work with sensors that
detect temperature, pressure, distance, and the like. The app recognizes the sensors automatically and sets up data streaming,
displaying the incoming data graphically as a stream in real time. See the HP StreamSmart 410 User Guide for complete details.
First connect the HP StreamSmart 410 to the HP Prime and then connect between one and four sensors to the HP StreamSmart.
Open the DataStreamer app by pressing
I and selecting DataStreamer. The app searches for any sensors that are connected
to the calculator and, when it finds them, prompts you to start the data capture by tapping
.
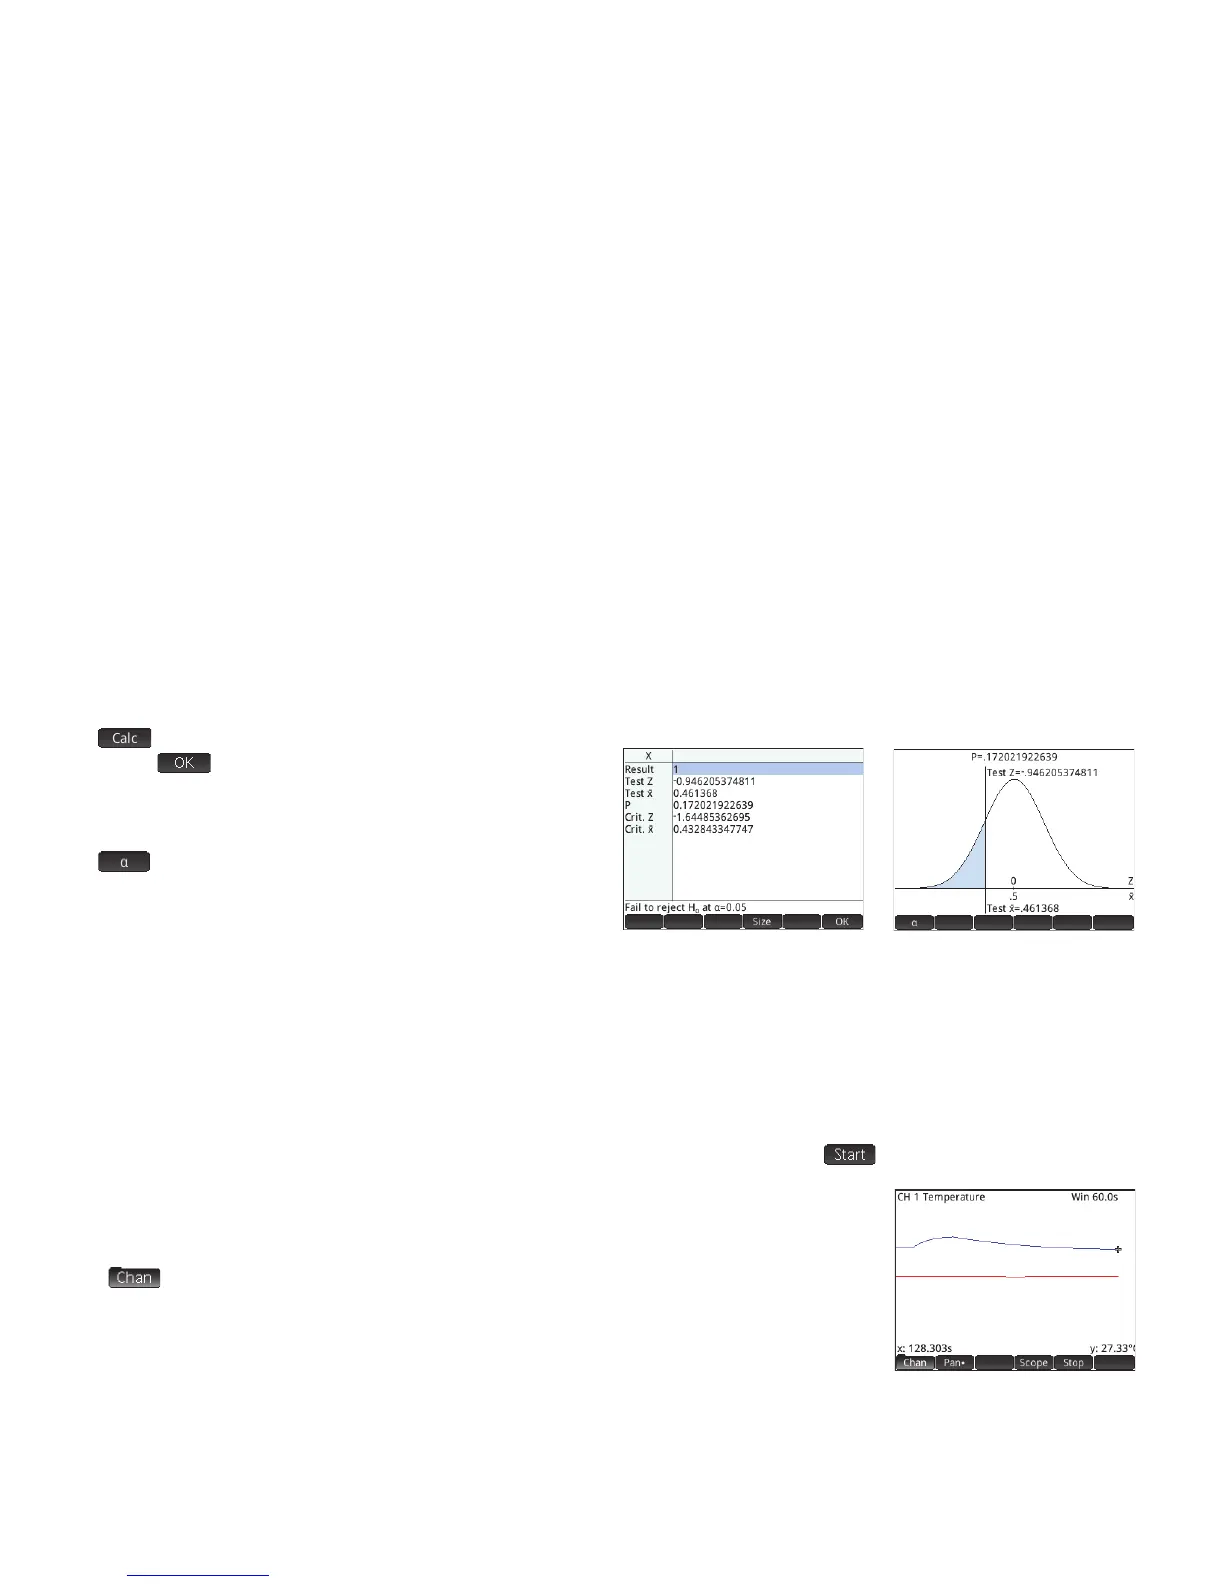
The DataStreamer app starts in Plot view. This view displays the data from 1 to 4 sensors
graphically as a live time graph called a data stream. Each line in the view represents data from
one sensor. The menu items are:
• : each sensor is allocated a channel. Tap this button to switch the focus to another
channel. You can also press 1, 2, 3, or 4 to switch focus to each of these channels. The
information displayed at the bottom of the screen is related to the currently selected channel.
In the example at the right, the Temperature channel is selected. This channel is taking
information from a temperature sensor in a beaker and that information is showing that
128.303 seconds after the start of the stream, the temperature in the beaker had reached 27.33°.
 Loading...