35
35
Statistics 1Var App
The Statistics 1Var app is designed for the study of univariate statistics. It provides tools for entering numeric data, calculating
1-variable summary statistics, and plotting 1-variable statistical graphs. The app can exchange data with the Statistics 2Var app
and the Spreadsheet app (explained in the User Guide). It can also receive data from the DataStreamer app and pass summary
statistics directly to the Inference app (where you can calculate confidence intervals and test hypotheses). To open the Statistics 1
Var app, press
I and select Statistics 1Var. The app opens in Numeric view.
Numeric view The Numeric view provides a table with up to ten columns for data, named D1
through D9 and D0. The menu items are:
• : activates the entry line for you to add a value or change the selected value
• : inserts a new row above the currently highlighted cell
• : sorts the current column; you can choose ascending or descending order
• : displays a menu for you to choose the small font, medium font, or large font
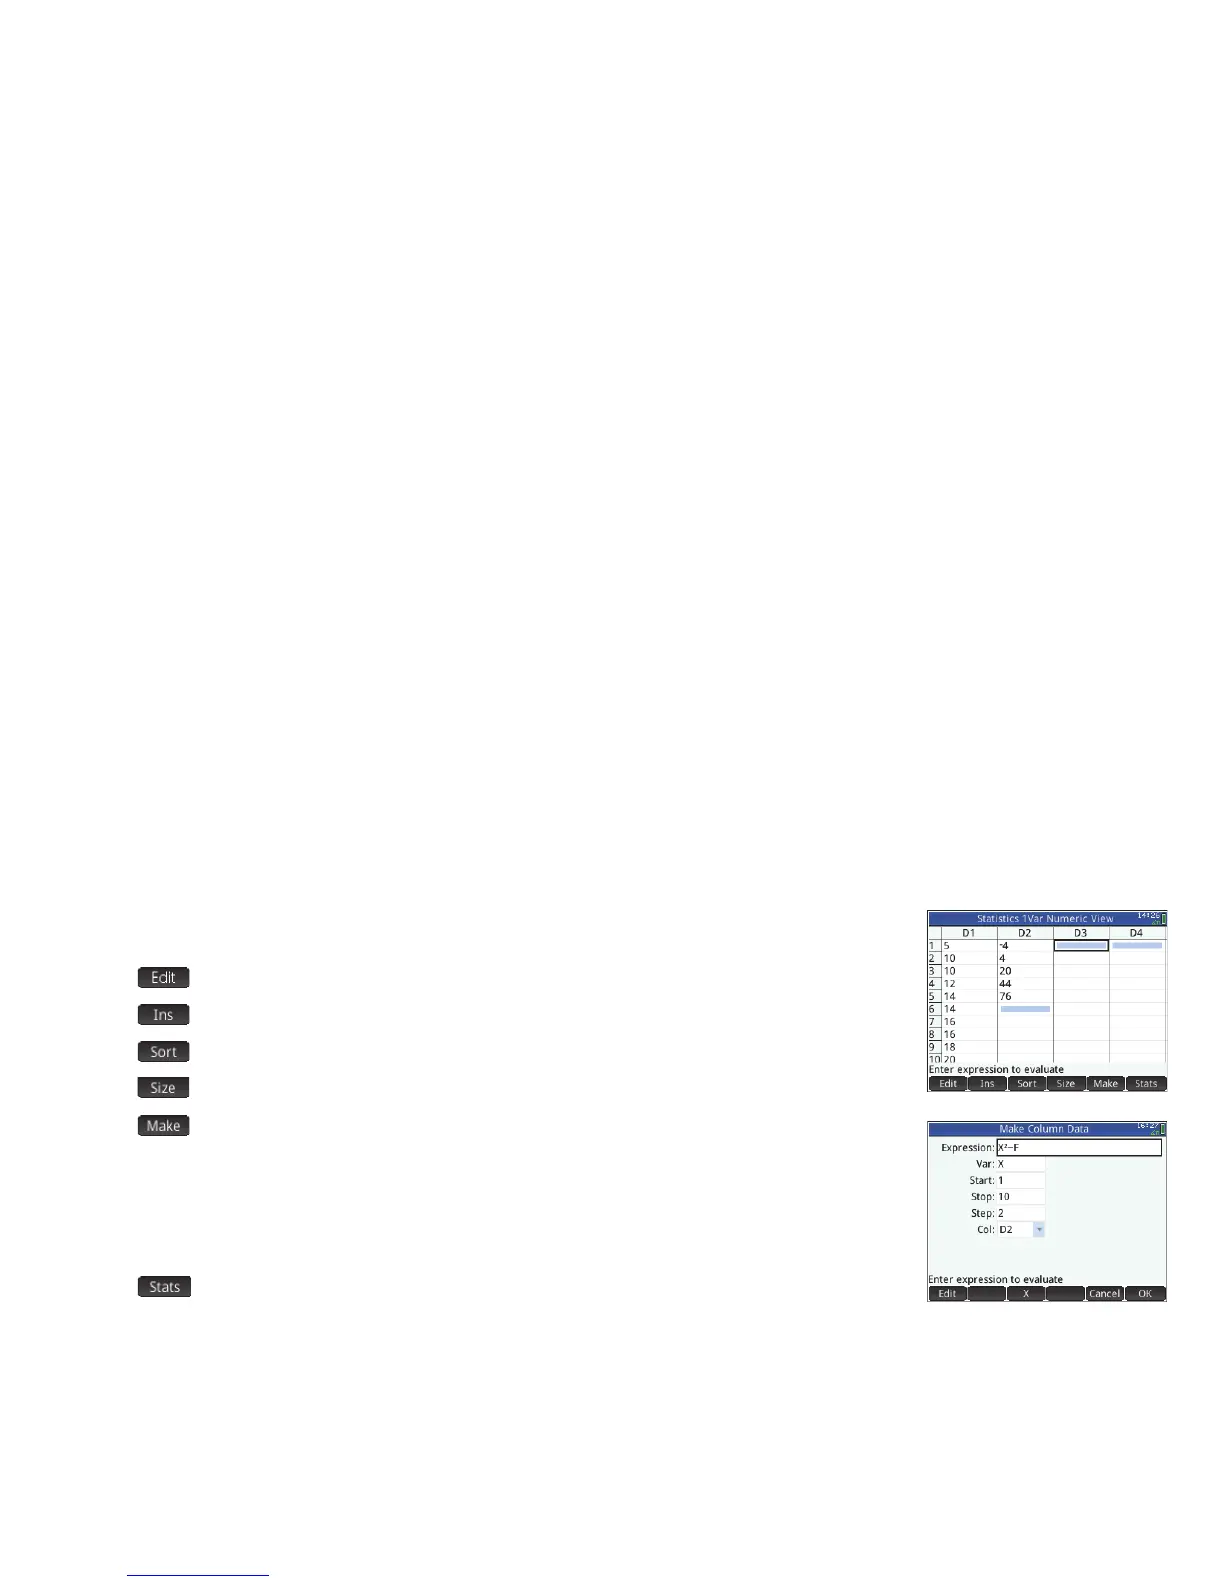
• : displays an input form for you to enter a formula to generate a list of values for a
specified column. In the example at the right, 5 data-points will be placed in column D2.
They will be generated by the expression X
2
– F where X comes from the set {1, 3, 5, 7, 9}.
These are the values between 1 and 10 that differ by 2. F is whatever value has been
assigned to it elsewhere (such as in Home view). If F happened to be 5, column D2 is
populated with {–4, 4, 20, 44, 76}.
• : provides summary statistics for the currently selected analyses defined in Symbolic
view. The statistics provided are n, Min, Q1, Med, Q3, Max, X, X
2
, Min, x
_
,sX, X, and
serrX.
 Loading...