38
38
When specifying dependent and independent columns in the Sn fields, you can enter column names (e.g. C1) or mathematical
expressions in terms of column names (e.g. 2*C1).
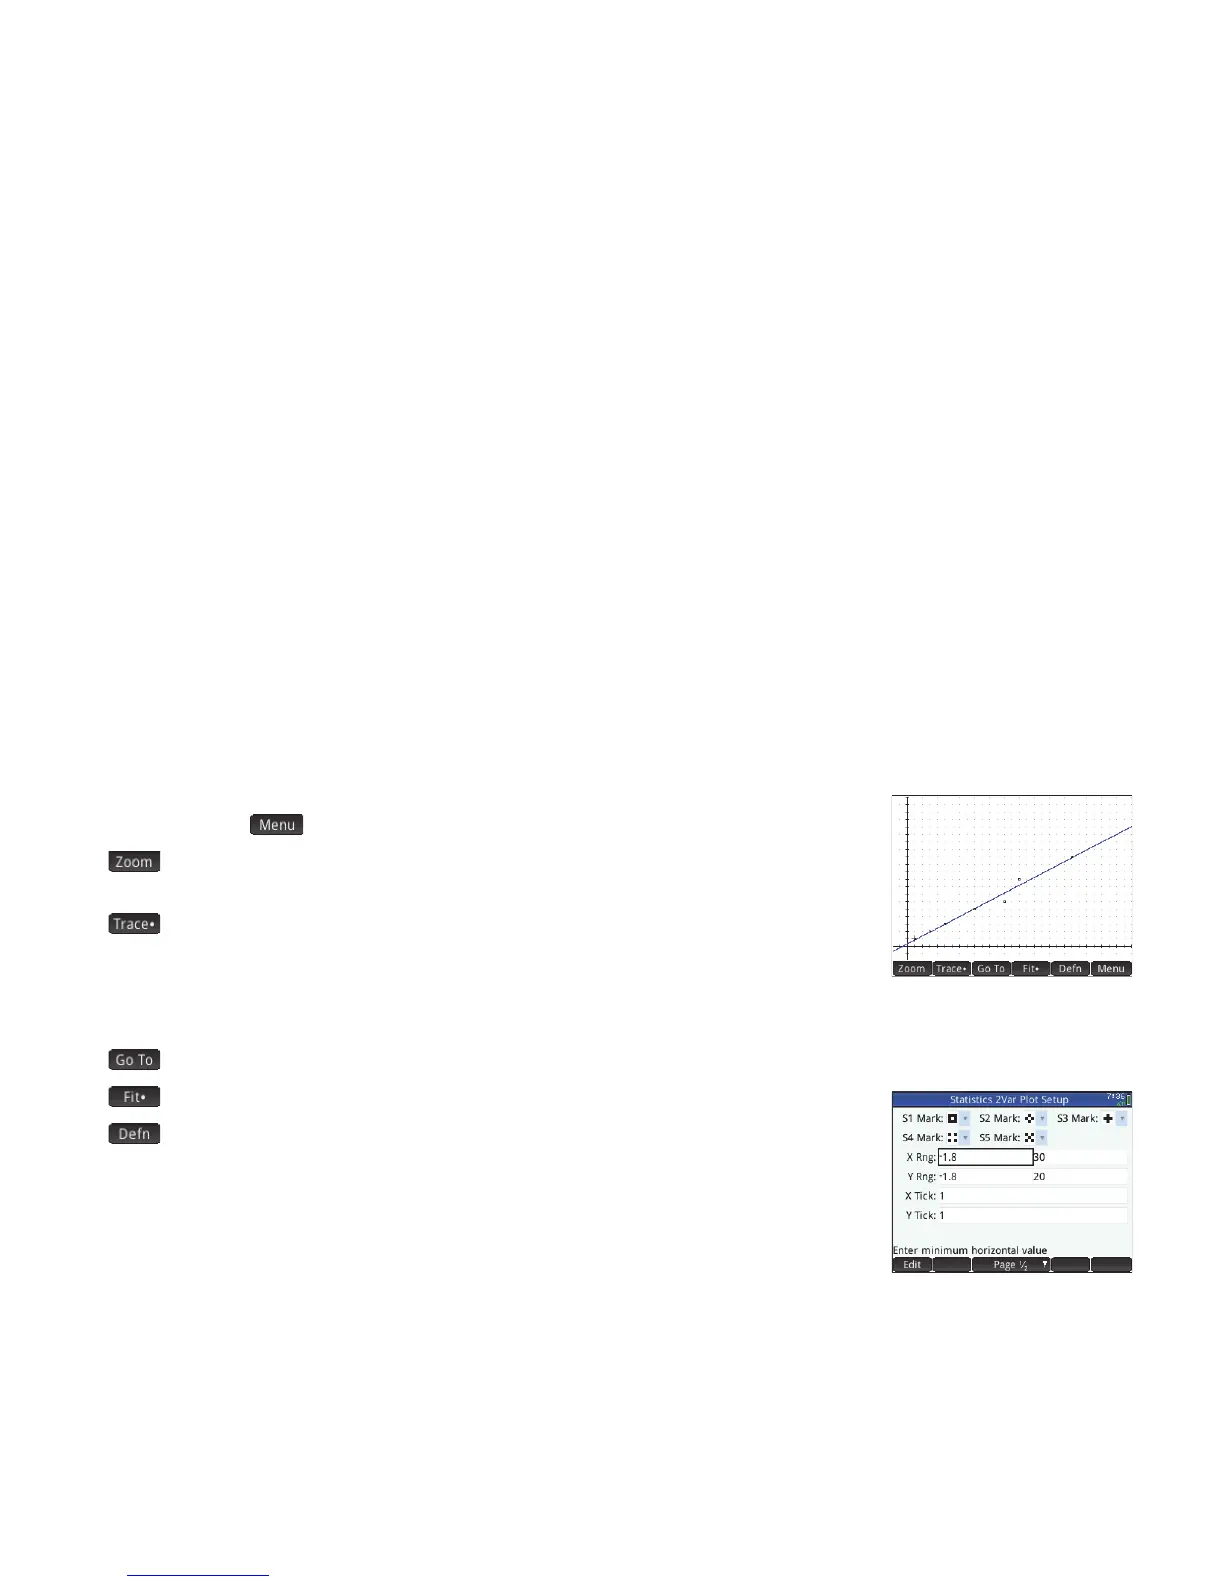
Plot view Press P to display the Plot view. This view displays the scatter plot for each
selected analysis. Tap to display (or hide) the full menu for this view. The menu items are:
• : displays the Zoom menu, with options to zoom in or out. You can also press + to
zoom in and w to zoom out.
• : toggles the tracing cursor off and on. With the tracing cursor on, you can press >
or < to move from data point to data point. The values of each point are displayed at the
bottom of the screen. If there is a fit equation displayed, you can press
= or \ to trace the
equation instead. Press
> or < to move along the equation. Values of the dependent
variable, as predicted by the fit equation, are displayed at the bottom of the screen.
• : takes the tracing cursor to the point you specify (or to the closest point)
• : shows (or hides) the graph of the fit equation
• : displays the columns used to define the graph or, if the tracing cursor is on a point
on the graph of the fit equation, the definition of the fit equation. You can also see the fit
equation by returning to Symbolic view and looking at the corresponding
Fitn field.
Plot Setup view Press SP to display page 1 of the Statistics 2Var Plot Setup view. This
view is similar to page 1 of the Statistics 1Var Plot Setup view, except that the
H Width and
H Rng fields have been replaced with fields that enable you too choose different data-point marks
for each scatter plot.
Page 2 of this view is identical to page 2 of the Function Plot Setup view (see page 20) except for the addition of a Connect field.
If this field is selected, the data points are connected by straight segments. Note that these segments do not constitute a fit.
 Loading...