Streaming Experiments
10
Table 2-1 Streaming experiment flow
Display Description
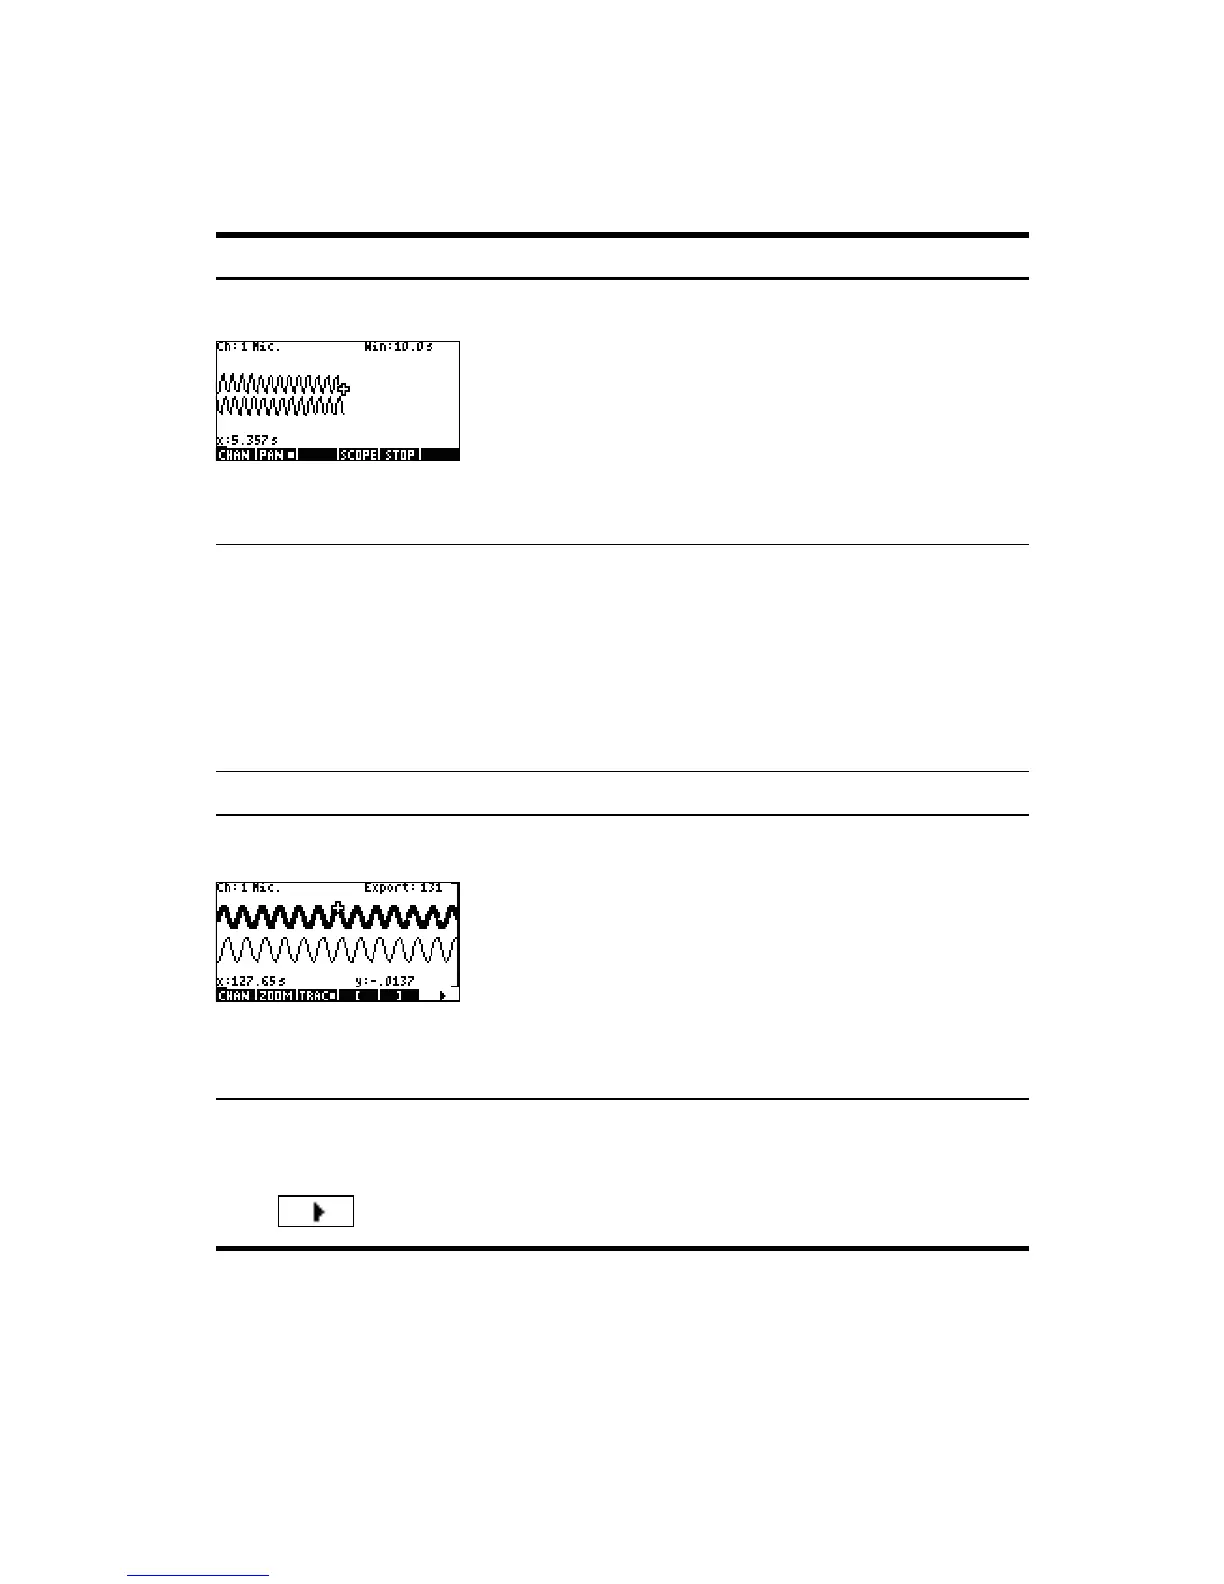
Figure 2-2 Stream
How I got there:
•Press
U Datastreamer %
What I see on screen:
• Up to four data streams displayed graphically in real-
time
• Channel number, sensor type and units for the current
selected stream, and screen width expressed in
seconds
What I can do:
• CHAN: select a channel (stream) to trace, etc.
• PAN/ZOOM: toggle between panning (scrolling) and zooming with direction keys
• PAN: scroll up, down, left, and right
• ZOOM: zoom in or out vertically or horizontally
• SCOPE: switch to oscilloscope mode (see Chapter 4)
• START/STOP: stop stream flow or start a new stream
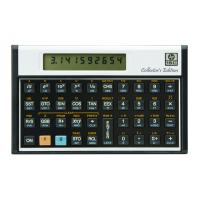
Display Description
Figure 2-3 Select,
page 1
How I got there:
•Press
@STOP @EXPRT
What I see on screen:
• Data streams
• Current channel and sensor, with tracer active
• Selected data set, based on the current channel, and
the number of data points ready for export
• Current tracer coordinates
What I can do:
• ZOOM, PAN, and TRACE to navigate the data streams and find data of interest
• CROP LEFT and CROP RIGHT
• (next page) to see more functions