25
Numeric view: the meter mode
Whether you choose to auto-number your selected events or add a numerical entry
to each event, experiments involving a series of distinct events always start in the
Numeric view of the StreamSmart Aplet. Once the StreamSmart Aplet is started
with at least one sensor and the StreamSmart 400 attached, press
S to view the
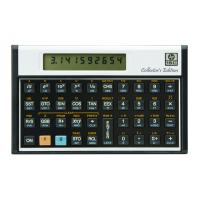
sensor readings in Meter mode. The Aplet displays a running meter which updates
a few times per second. The meter identifies up to four attached sensors, the units
for each sensor, and the current reading of each sensor. A sample display is shown
below in Figure 3-5. In this figure, a 2.5A current sensor is plugged into Channel
1 (CH1:) and a 2.5V voltage sensor is plugged into Channel 2 (CH2:).
Figure 3-5
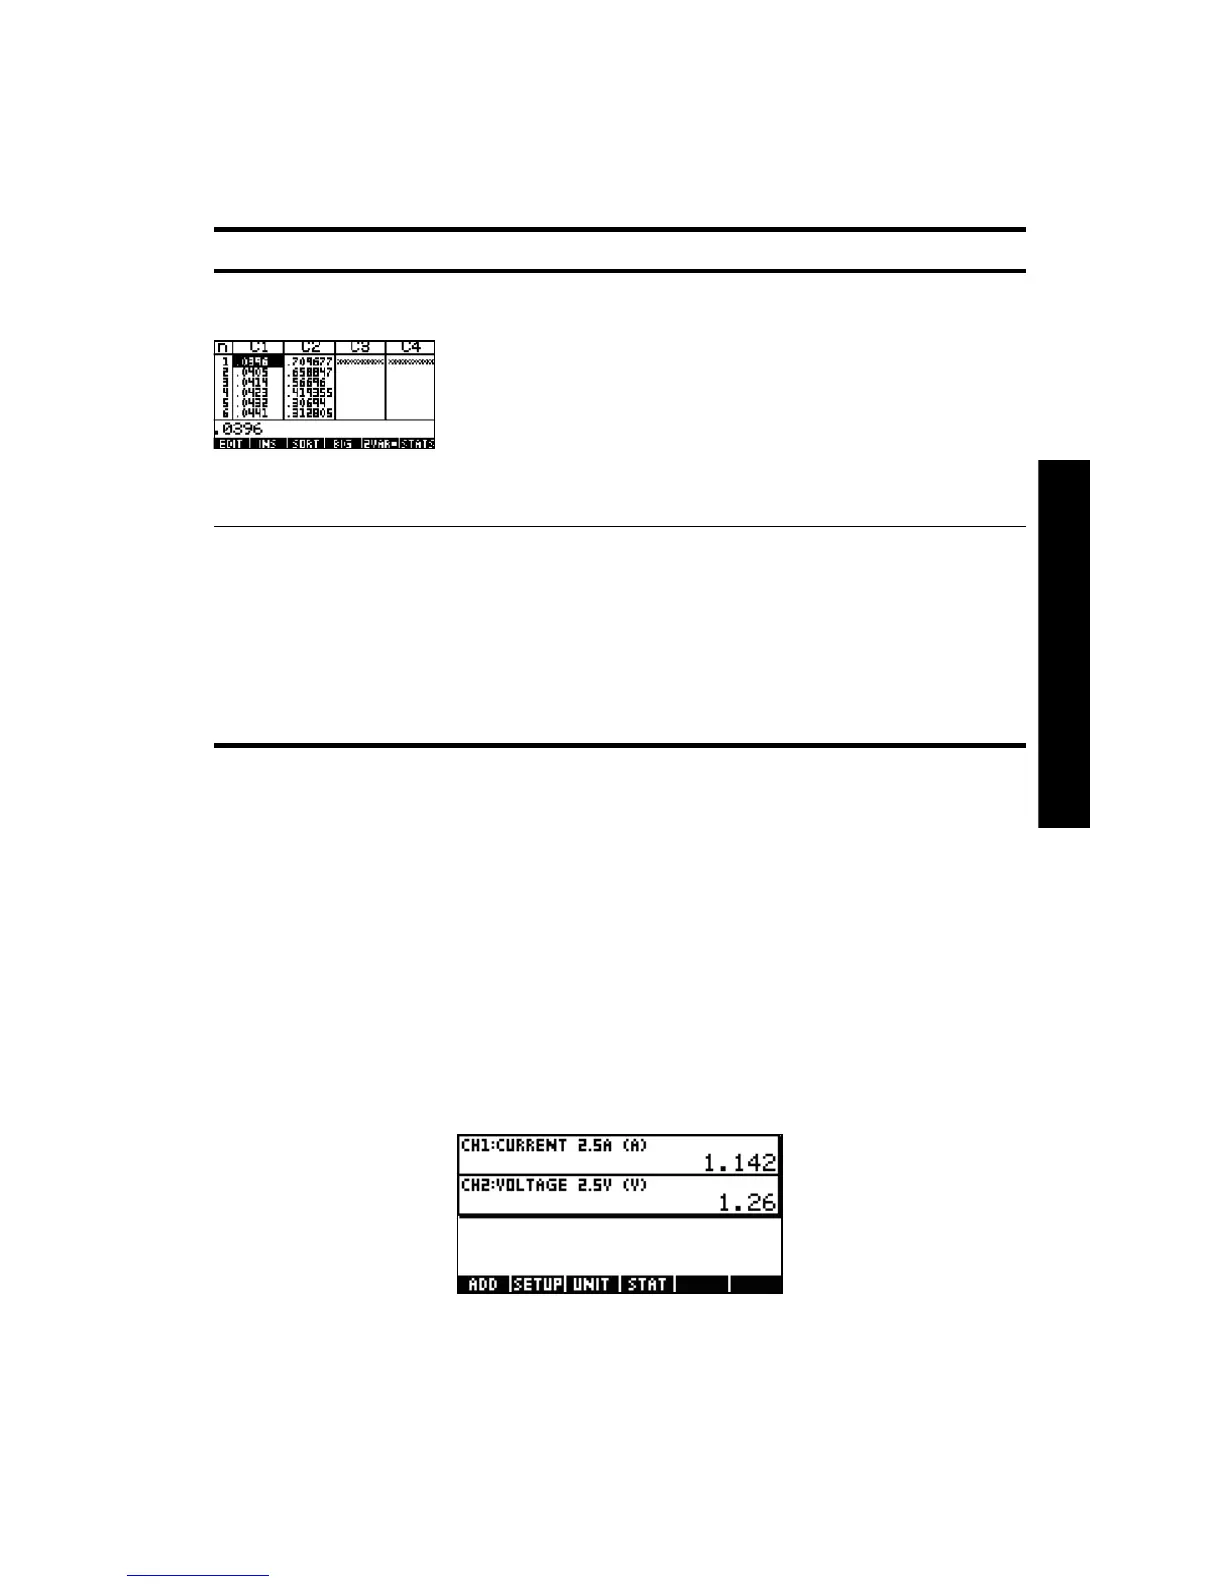
Figure 3-4 Analyze data
How I got there:
•Press
@STAT!
What I see on screen:
• Numeric view of data in the Statistics
Aplet
What I can do:
• TABLE: scroll through the table of data using
W, X, Z, and Y
• GRAPH: graph data using
V Auto Scale
• 1VAR/2VAR: toggle between analysis of 1-variable and 2-variable data
• STATS: view summary statistics
• MORE: see the HP 39/40gs User’s Guide for more information on the Statistics Aplet,
including regression fit types and statistical plot types
Table 3-1 Capturing data from discrete events
View Description