Streaming Experiments
12
Viewing a stream of data
Once the StreamSmart Aplet is started with one or more sensors and the
StreamSmart 400 attached, the StreamSmart Aplet displays a graphic
representation of the incoming data streams as time graphs. The horizontal
dimension represents time in seconds, and the vertical dimension represents the
current sensor values in relevant units. Because only one stream may be traced at
a time, the display also identifies the currently selected data stream, the units of
measurement of the selected stream, and the length of time represented by the
width of the display screen.
The StreamSmart Aplet first tries to identify the attached sensors and makes several
decisions based on the characteristics of the sensors. The StreamSmart Aplet sets
the vertical scales for each data stream based on the units of the sensor and the
initial readings
. The StreamSmart Aplet also sets the horizontal scale for the length
of time represented by the width of the display. These default settings ensure that
the streams are visible in the display and moving at a perceptible rate. You can
vary the speed and vertical position of the streams to meet your needs, even while
the data is streaming. Occasionally, the StreamSmart Aplet may not be able to
identify a sensor. See Chapter 4, Advanced Topics for details on how to manually
identify an unrecognized sensor.
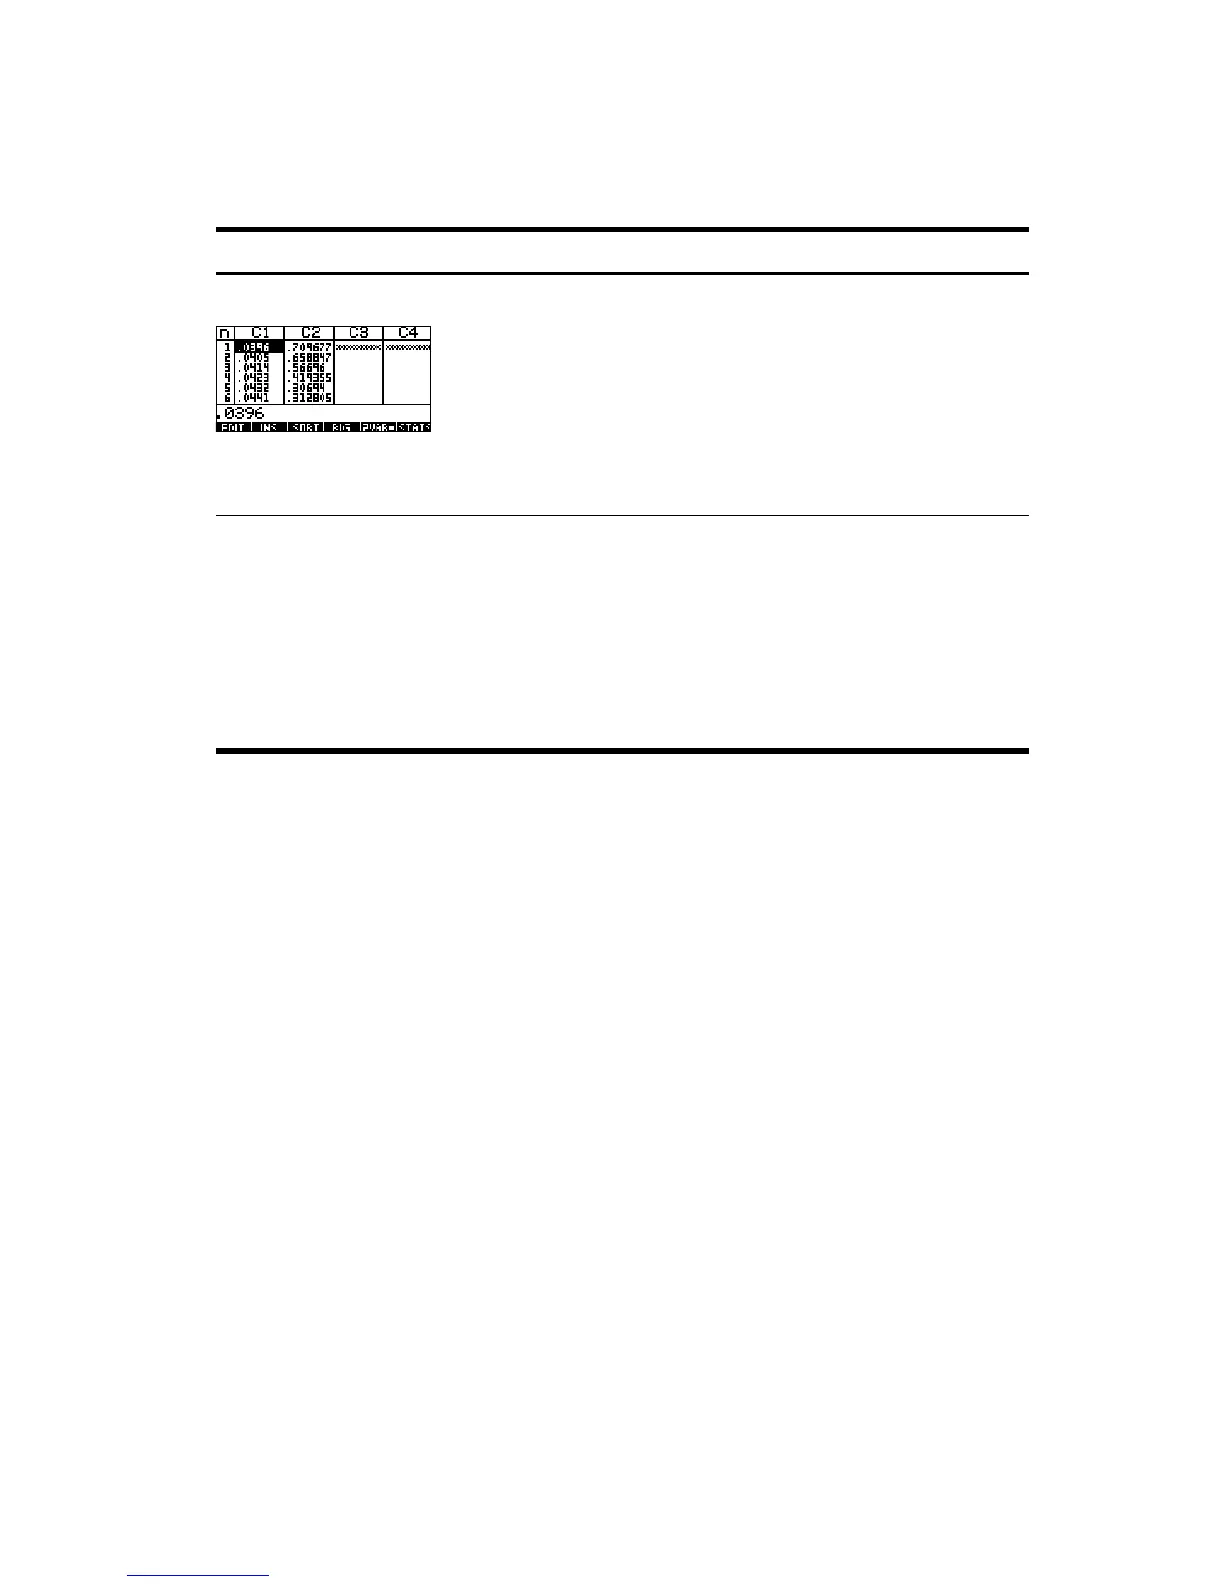
Figure 2-6 Analyze the
data
How I got there:
• Press
&!OK& and then press any key
What I see on screen:
• Numeric view of the Statistics Aplet, with data in
columns
What I can do:
• TABLE: scroll through the table of data using
W, X, Z, and Y
• GRAPH: graph data using
V Auto Scale
• 1VAR/2VAR: toggle between analysis of 1-variable and 2-variable data
• STATS: view summary statistics
• MORE: see the HP 39/40gs User Guide for more information on the Statistics
Aplet, including regression fit types and statistical plot types
Table 2-1 Streaming experiment flow
Display Description