29
Analyze the data
Once you have captured all your events, press the @!STAT@ menu key to proceed to
the Statistics Aplet, where your data set has been saved. For a brief summary of
the Statistics Aplet, refer to the section titled, Analyze experimental data in Chapter
2. For more complete information, please consult the HP 39/40gs User’s Guide.
Data logging
Under certain circumstances, it is desirable to run an experiment for a particular
duration (e.g., 3 seconds exactly) and collect a particular number of samples (e.g.,
50 samples). The StreamSmart 400 accommodates this need via the
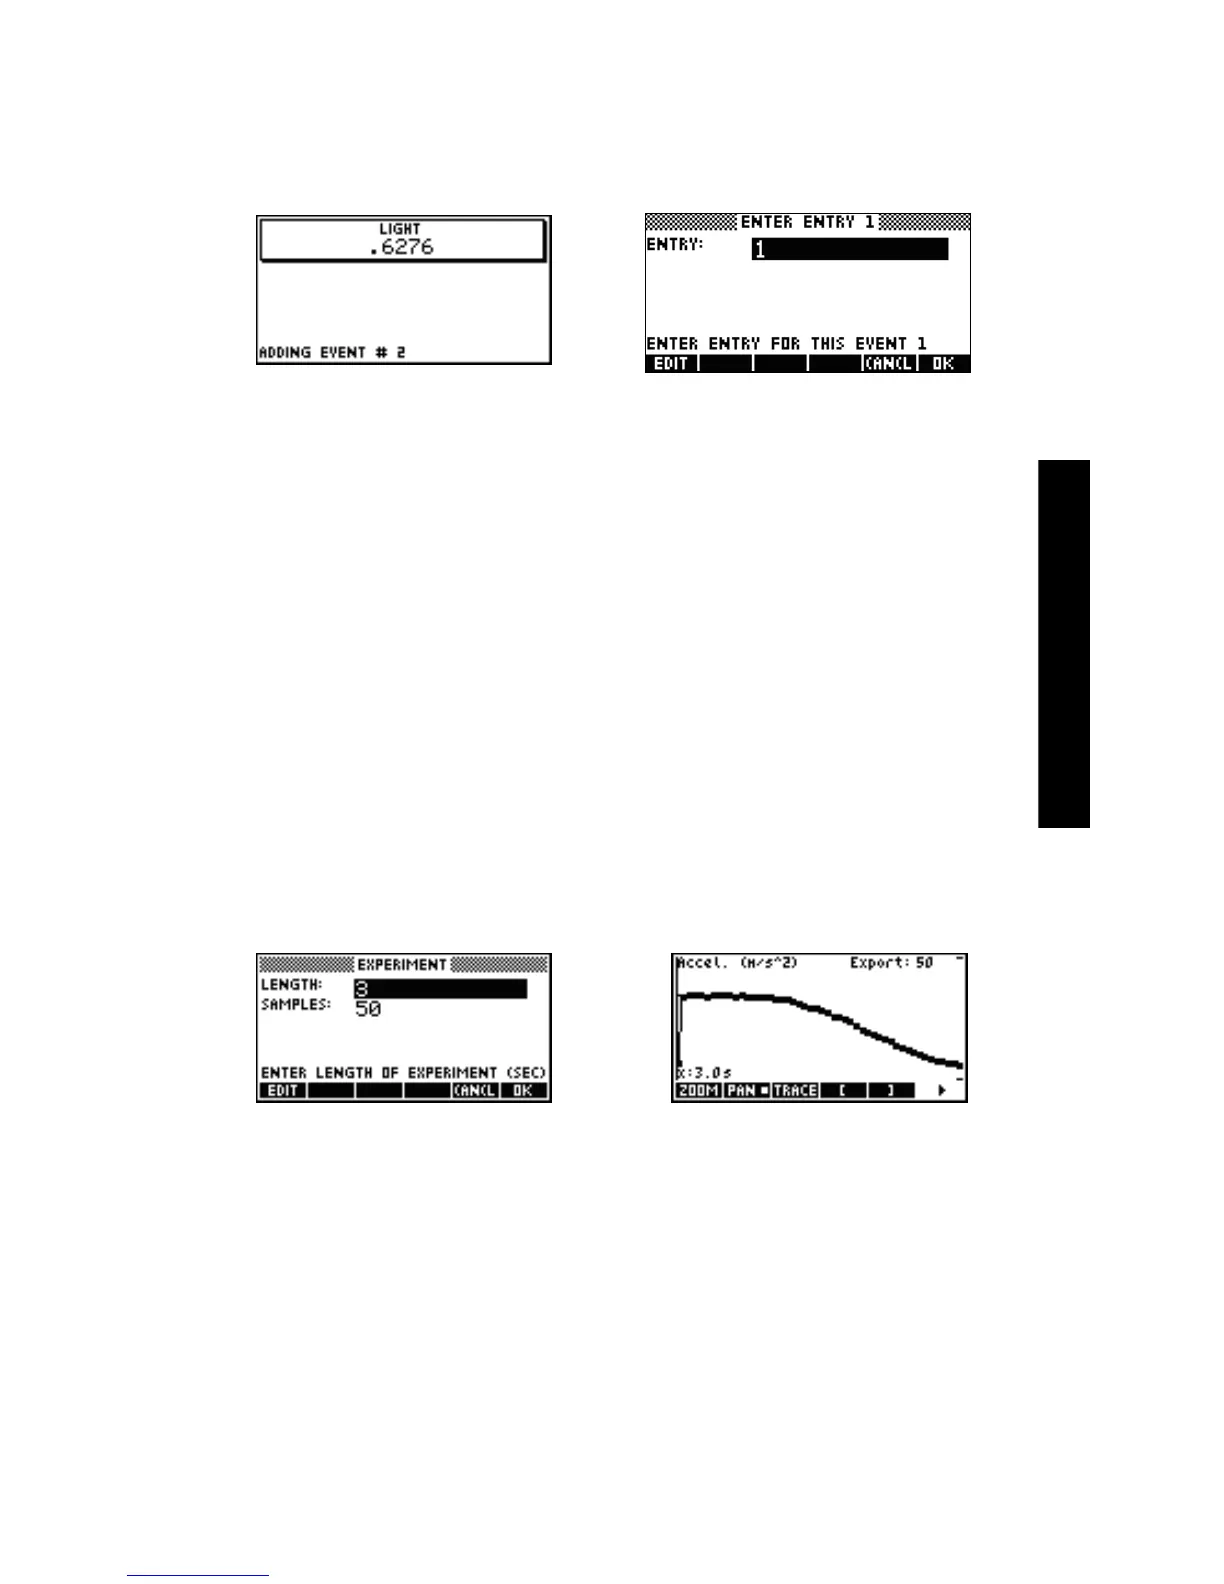
Experiment option under the Views menu, as illustrated in Figure 3-12 and
Figure 3-13.
1. P r e s s V Experiment to enter the Experiment menu.
2. Set LENGTH to 3 seconds and SAMPLES to 50.
3. Press $#OK?@ to trigger data collection.
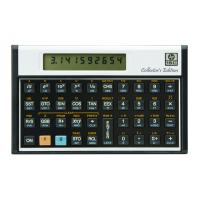
Data collection is shown as a time graph, just like a streaming experiment.
However, StreamSmart collects 50 discrete sets of sensor readings in a 3-second
period at a uniform frequency of 1 reading every 0.06 seconds. The Figure 3-13
shows 50 data points have been collected (Export:50) and the trace cursor
readout at the far left of the screen shows that the elapsed time is exactly 3.0
Figure 3-10 Event Only Figure 3-11 With Entry
Figure 3-12 The Experiment menu Figure 3-13 50 readings in 3 sec.