21
The Numeric view shows your columns of data arranged in a table. Although only
four columns are displayed, there are actually ten columns available. Use
Y and
Z to move from column to column; use X and W to navigate through the data
in a column.
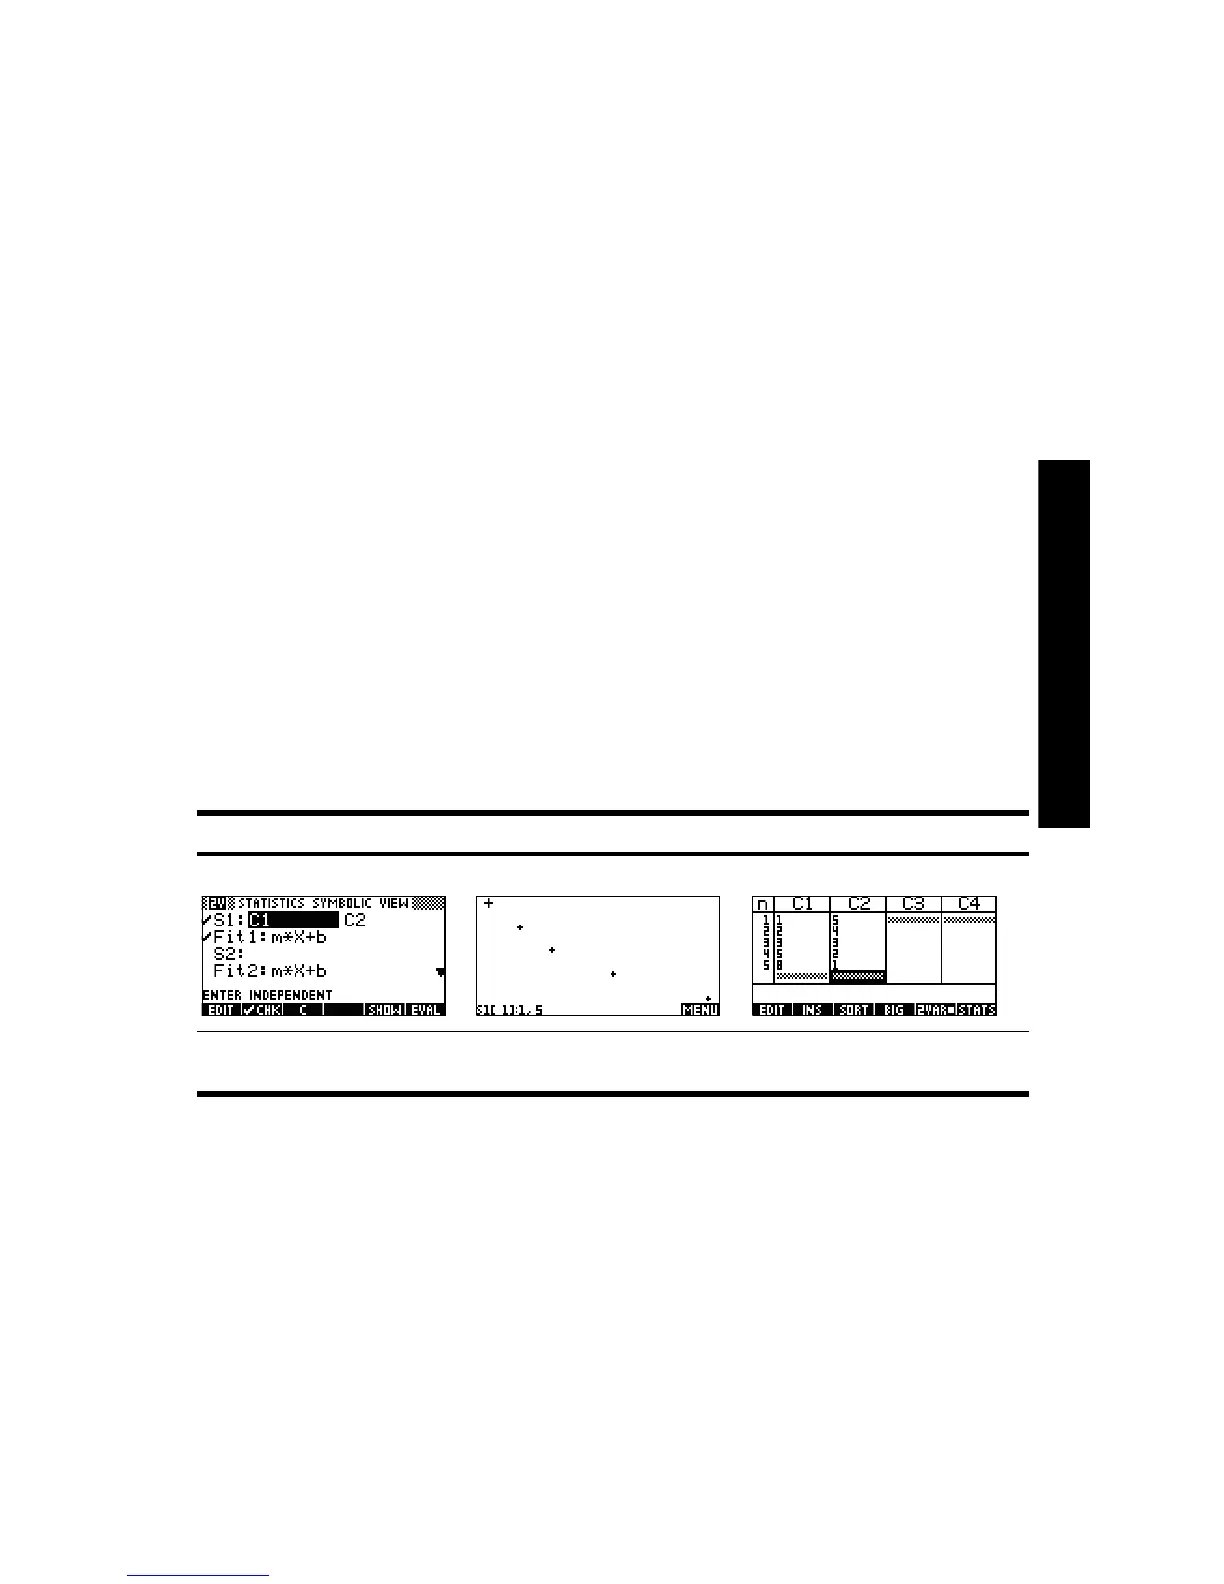
One key to understanding the Statistics Aplet is the !1VARqqq!/!2VARqqq! menu key. Press
this key to toggle between 1-variable and 2-variable statistics. If set to !1VARqqq! , you
are studying the data column by column; if set to !2VARqqq!
, you are studying the
relationship between any two columns of data. Press
Q to enter the Symbolic view
of the Aplet and define which columns to study. In 1-VA R mode, the Symbolic view
will let you define up to five histograms, or box-and-whisker plots: H1, H2, H3, H4,
and H5. Each plot can take one column for its data and another for its frequency,
or one column for the data and a common frequency you enter manually. In 2-VAR
mode, the Symbolic view will let you define up to five scatter plots (S1, S2, etc.).
Press
@ Q (Plot Setup) to select a fit model for each scatter plot.
The easiest way to see a graph of your data is to press
V and select the
Autoscale option. If your graph is a scatter plot, press @MENU! and then $@FIT#@ to
see the fit model plotted with your data. The views of the Statistics Aplet are
summarized in Table 2-8 and Table 2-9. For more information, please refer to the
HP 39/40gs User Guide.
Table 2-8 Views in the Statistics Aplet
Symbolic Plot Numeric
Figure 2-14 Define an
analysis
Figure 2-15 Statistical
plot
Figure 2-16 Table of
values