Advanced Topics
38
3. Use
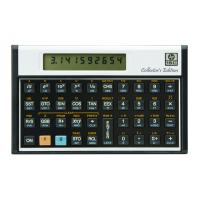
X and W to highlight your selection and press the $OK# key.
4. Press
R to return to the graphic view using the new filtering method.
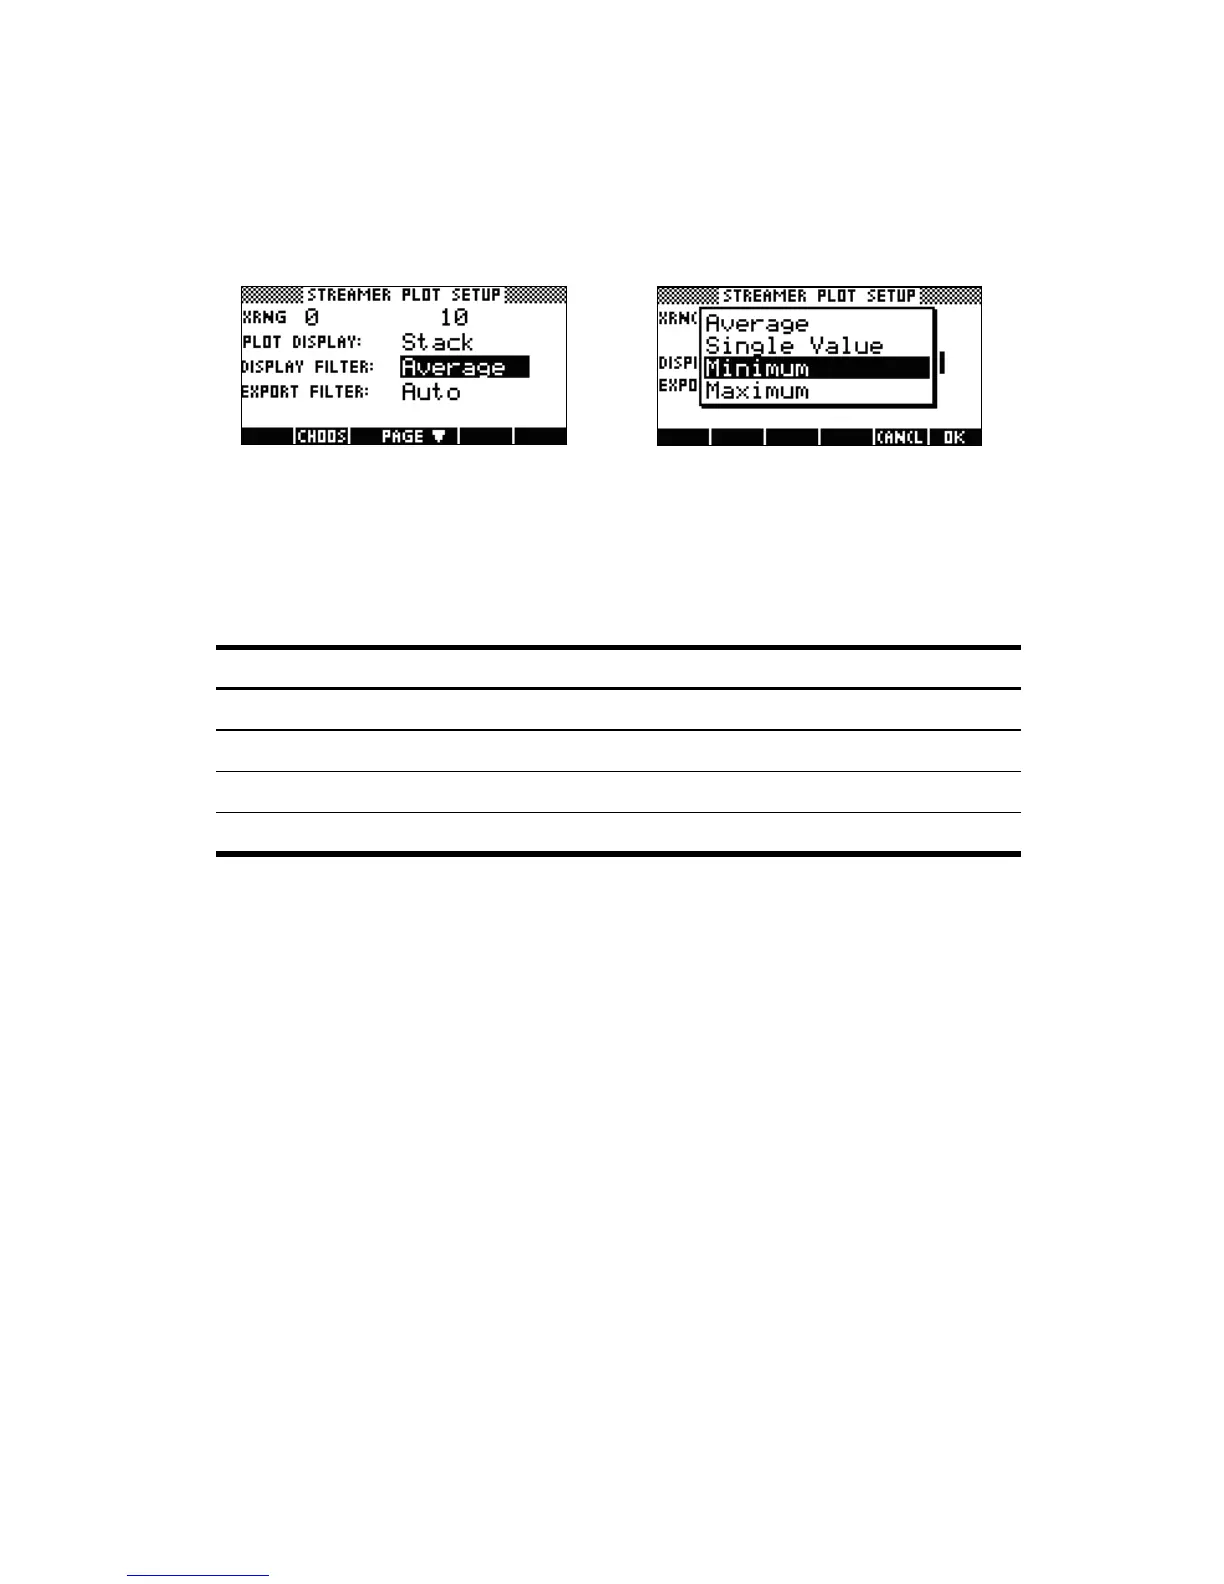
Table 4-1summarizes the display filtering options available in the Display Filter
field of the Plot Setup menu.
In the same way that data is filtered for display in the StreamSmart Aplet, it is also
filtered for export to the Statistics Aplet.
To choose an export filtering method:
1. P r e s s
@ R to enter the Plot Setup menu and use the X key to highlight
the EXPORT FILTER field.
2. Press the
!CHOOS menu key to see the list of options.
3. Use X and W to highlight your selection and press
$OK#.
4. Press
R to return to the graphic view, and then press EXPORT to export
data to the Statistics Aplet using the new filtering methods.
The export options are the same as the options for display filtering, with two
additions. The additional options are summarized in Table 4-2.
Figure 4-27 Figure 4-28
Table 4-1 Display filters
Name Description
Average Uses the average of the data in each pixel interval to represent the data.
Single Value Uses a single value to represent the data.
Minimum Uses the minimum value to represent the data.
Maximum Uses the maximum value to represent the data.