5
All of the views listed in Table 1-2 can be accessed via the Views menu by pressing
V. In addition to these standard Aplet views, the Views menu also contains views
specific to the StreamSmart Aplet. These views are listed below in Table 1-3.
Details on these views can be found in Chapter 4, Advanced Topics.
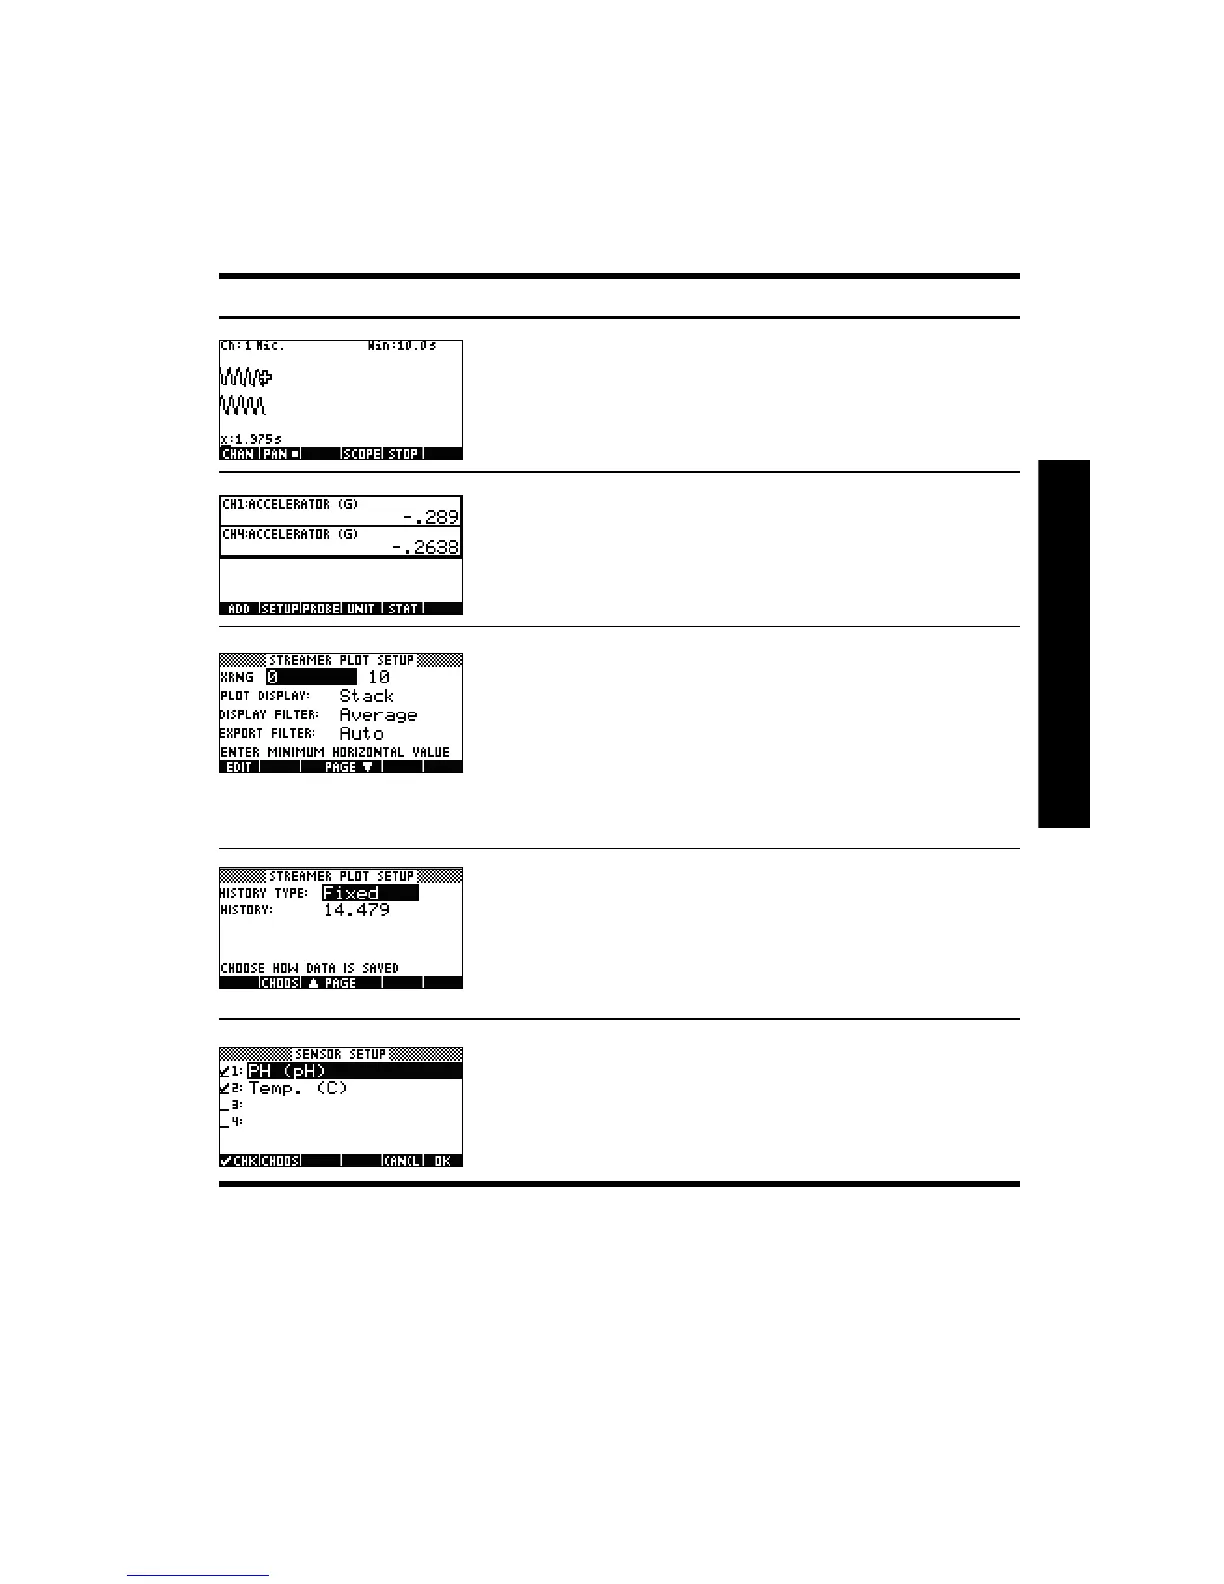
Table 1-2 StreamSmart standard views
View Name/Key(s) Description
Plot
R
• View up to four data streams
graphically as time graphs
• Perform streaming experiments
•See Chapter 2, Streaming
Experiments for details
Numeric
S
• View up to four sensors numerically
in a meter
• Perform selected events and events-
with-entry experiments
•See Chapter 3, Capturing Data
from Events for details
Plot setup
(page 1)
@R
• Optional: set up the window for the
graphic view of the data stream
• Optional: choose stacked display of
multiple data streams or overlaid
display (superimposed)
• Optional: choose data filters for
display and export of data
•See Chapter 4, Advanced Topics
for details
Plot setup
(page 2)
• Optional: select a history of fixed
length (in seconds), or an automatic
history that keeps the most current
data but saves less and less of
earlier data from the stream(s)
•See Chapter 4, Advanced Topics
for details
Numeric
setup
@S
• Activate and deactivate individual
channels from the four channels of
the StreamSmart 400
• Choose sensor units
•See Chapter 4, Advanced Topics
for details