PC-POD-CP-010-v01 Printed copies are not controlled. Page 6 of 14
5.6 Press “Test” on screen using stylus pen.
NOTE: Stylus should always be used when making selections on touch screen.
5.7 Press “Start”. Screen will display “Calculating”.
5.8 Should it read “pass”, device is ready to use
NOTE: Should it read “fail”, contact area supervisor.
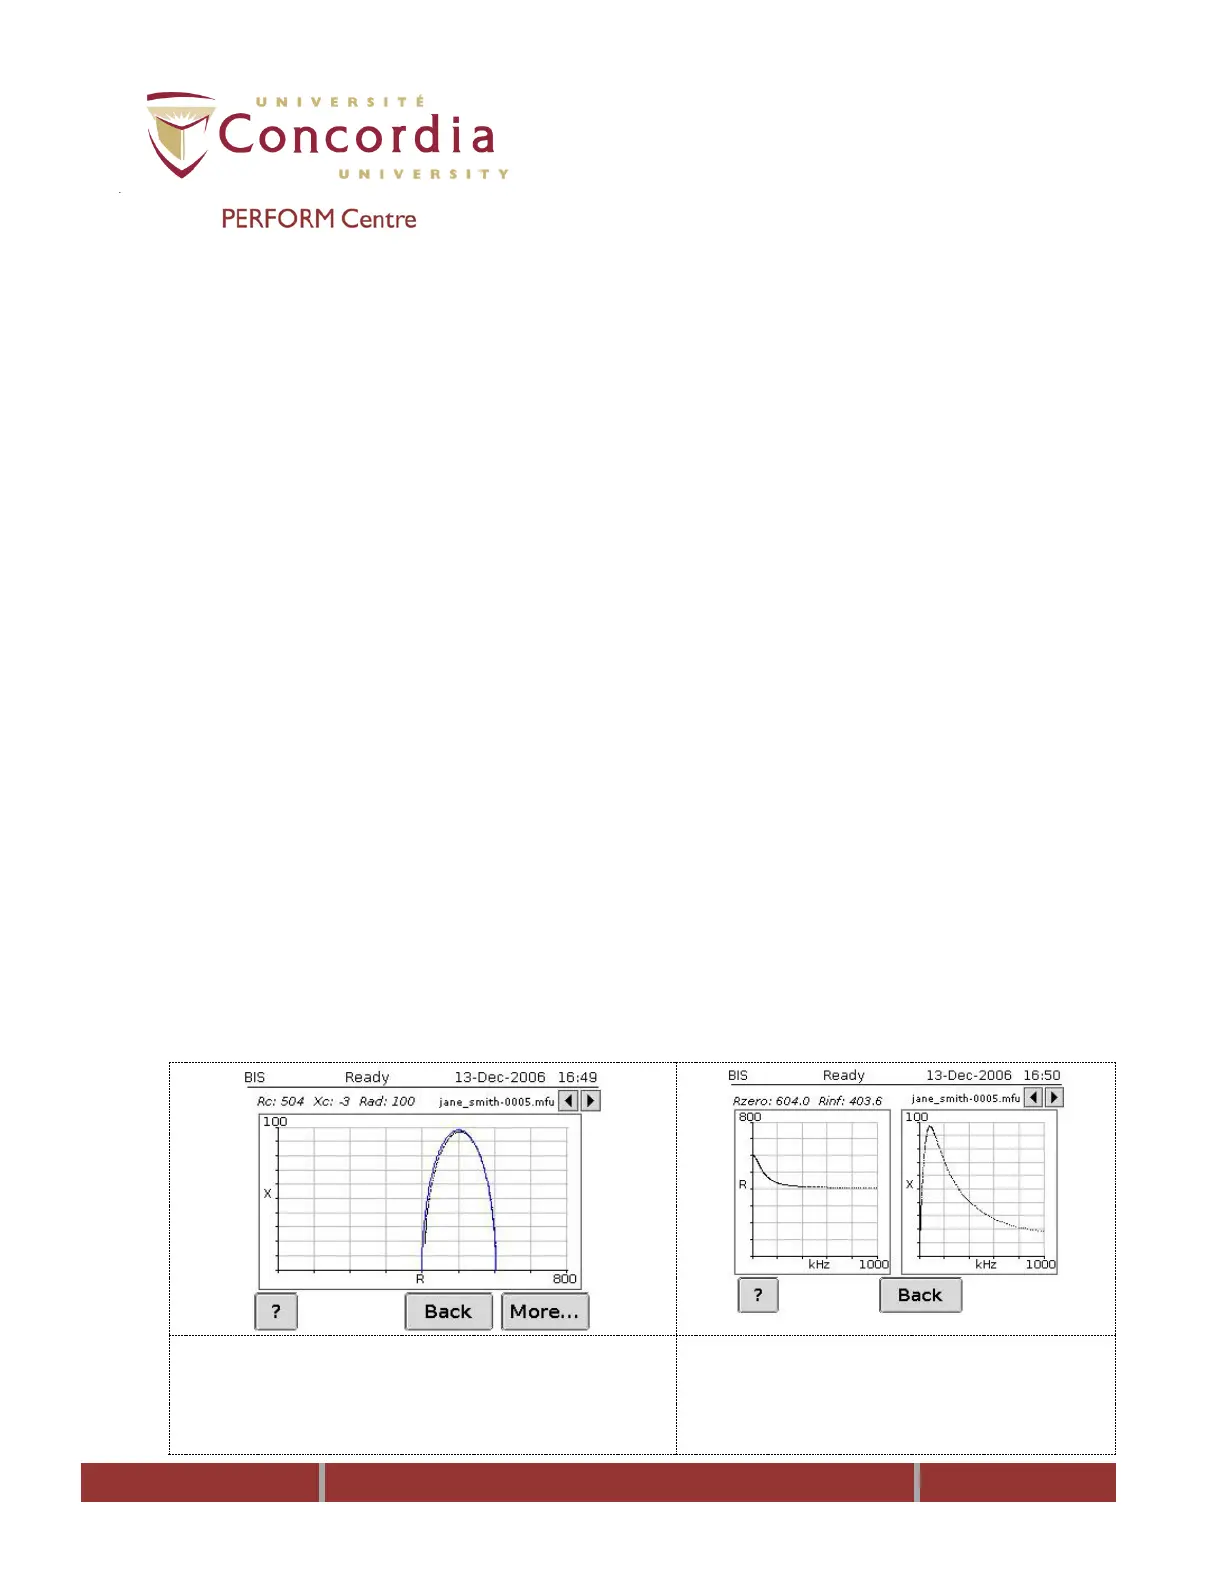
5.9 Click “More” and when the graph is displayed click “More” again. “Rzero”
and “Rinf” should read “Rzero: 604 (± 7 ohms)” and “Rinf: 403 (± 5 ohms)”.
5.10 Press “Back” 4 times.
5.11 Disconnect the leads from test cell and replace the alligator clips.
NOTE: Failing to adhere to the above conditions may affect your results.
6 Modes & Predetermined Measurement Settings
The ImpediMed SFB7 offers two modes of functions: bioimpedance spectroscopy (BIS),
and selected frequencies (SFBI).
6.1 BIS Mode
This mode measures BI paramaters over a frequency range of 4-1000 kHz with 256
data points defining the BIS mode as a true BI spectroscopy. On-screen graphs display
the measured data in the form a cole-cole plot.
Reactance vs. Resistance: The Cole-Cole plot gives a visual representation
of the measurement and is used to indicate a valid measurement has been
taken. The absence of scattered data points and well fit Cole-Cole plot
signifies noise free data and that a valid measurement has been performed.
Resistance vs. frequency plot and reactance vs. frequency plots
are visual representation of the measured bioimpedance data.