22
◆
Kappa Series Powered Subwoofer – Owner’s Manual
Whenever your answer has a remainder, always round down (disregarding the negative
[-]) to the next whole number.
In our example, you would enter 9 in the attenuation field.
This may not be the best method in all cases. The next section contains several other
examples.
As stated earlier, it is not possible to anticipate the effect of every possible listening
environment. However, most residential sound rooms share many characteristics, and
their dimensions fall into a range that make some response irregularities far more likely
than others. On the following pages are examples of what you may encounter.
Following each example is a strategy for correction. Compare your measurement
results with the following examples. Find the one that best fits your graph and follow
the instructions presented for that scenario.
Remember, when looking for a match, look at the descriptive characteristics,
not any specific frequency or level. Each of these examples can occur at any
frequency, bandwidth and level. It is unlikely that your test results will be exactly as
depicted in these examples.
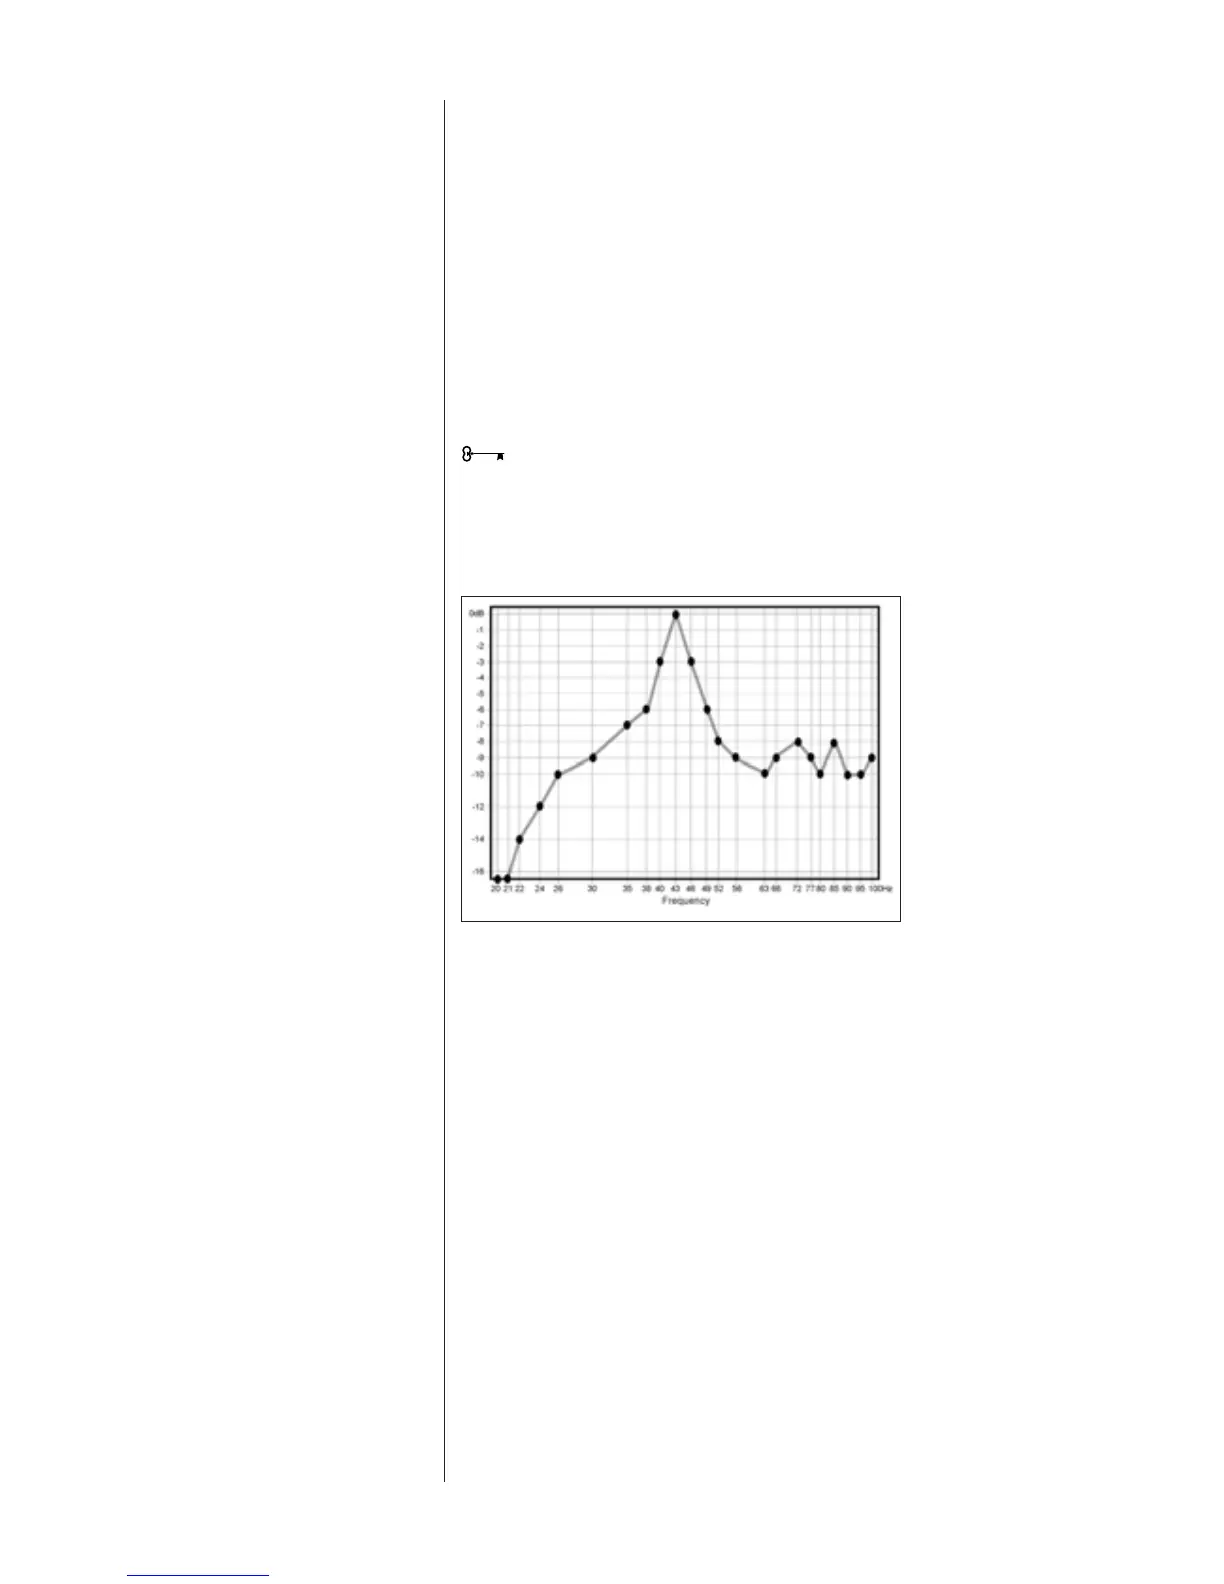
Example 1. Single Dominant Peak:
This is the most common result of speaker/room interaction.
Apply the Width Selector as described in Figure 15. Align the center-line of the Selector
over the center of the peak, as shown in Figure 16. Now adjust the Selector until you
have achieved the “best fit”. The slider now points to the correct bandwidth setting. In
this example, the frequency is 43Hz and the best-fit width is 12.5%. Fill in the Width
and Frequency fields provided on the template.
Determine the appropriate level using the technique described earlier. In this example,
-9 dB would be best. Enter the level in the field provided.
Skip to the “Adjusting the R.A.B.O.S. Equalizer” section on page 28.
What You Measure,
What To Do
Figure 17
Single dominant peak