40 English Inspire System Models 3024, 4063, 4323
200-079-101 Rev A
3024EN_ch.fm 5/6/14 10:31 pm
4.625 x 6 inches (117 mm x 152 mm)
Inspire Medical Confidential
Efficacy
The sleep studies, which were scored by an independent sleep scoring core lab, showed
statistically significant and clinically relevant reductions in the patients' AHI and ODI scores.
Table 6 reports the percentage of patients who experienced a clinically meaningful reduction in
their OSA severity (i.e., responders). As this is an intent to treat study, these results are based
on a total of 126 patients even though only 124 patients provided evaluable data through 12 and
18 months. The other 2 patients are assumed to be non-responders and are included in the
evaluation as such.
The average reduction of AHI from baseline to 12 months was 68% and 70% for ODI. Baseline
AHI showed a mean of 32.0. In comparison, the AHI at the 12-month PSG study showed a
mean of 15.3. Baseline ODI showed a mean of 28.9. In comparison, ODI at the 12-month PSG
study showed a mean of 13.9. The patients also had statistically significant improvements in
terms of time with SaO
2
< 90%, ESS and FOSQ scores at 12 months relative to baseline. The
mean FOSQ score at baseline was 14.3, at the 12-month visit it was 17.2, and at the 18-month
visit it was 17.3. The mean ESS score at baseline was 11.6, at the 12-month visit it was 7.0, and
at the 18-month it visit was 7.0. The mean percentage of sleep time with SaO2 < 90 at baseline
was 8.7%, at the 12-month visit it was 5.9%, and at the 18-month visit it was 5.6%. These
results through 18 months show the durability of Inspire therapy's treatment effect.
The randomized controlled therapy withdrawal study provided further evidence that
improvements were attributed directly to the Inspire therapy. AHI increased significantly in the
therapy withdrawal (OFF) group compared to AHI scores in the therapy maintenance (ON)
group. The results from the randomized control therapy withdrawal study showing the difference
between the therapy OFF arm and the therapy ON arm are provided in Table 7.
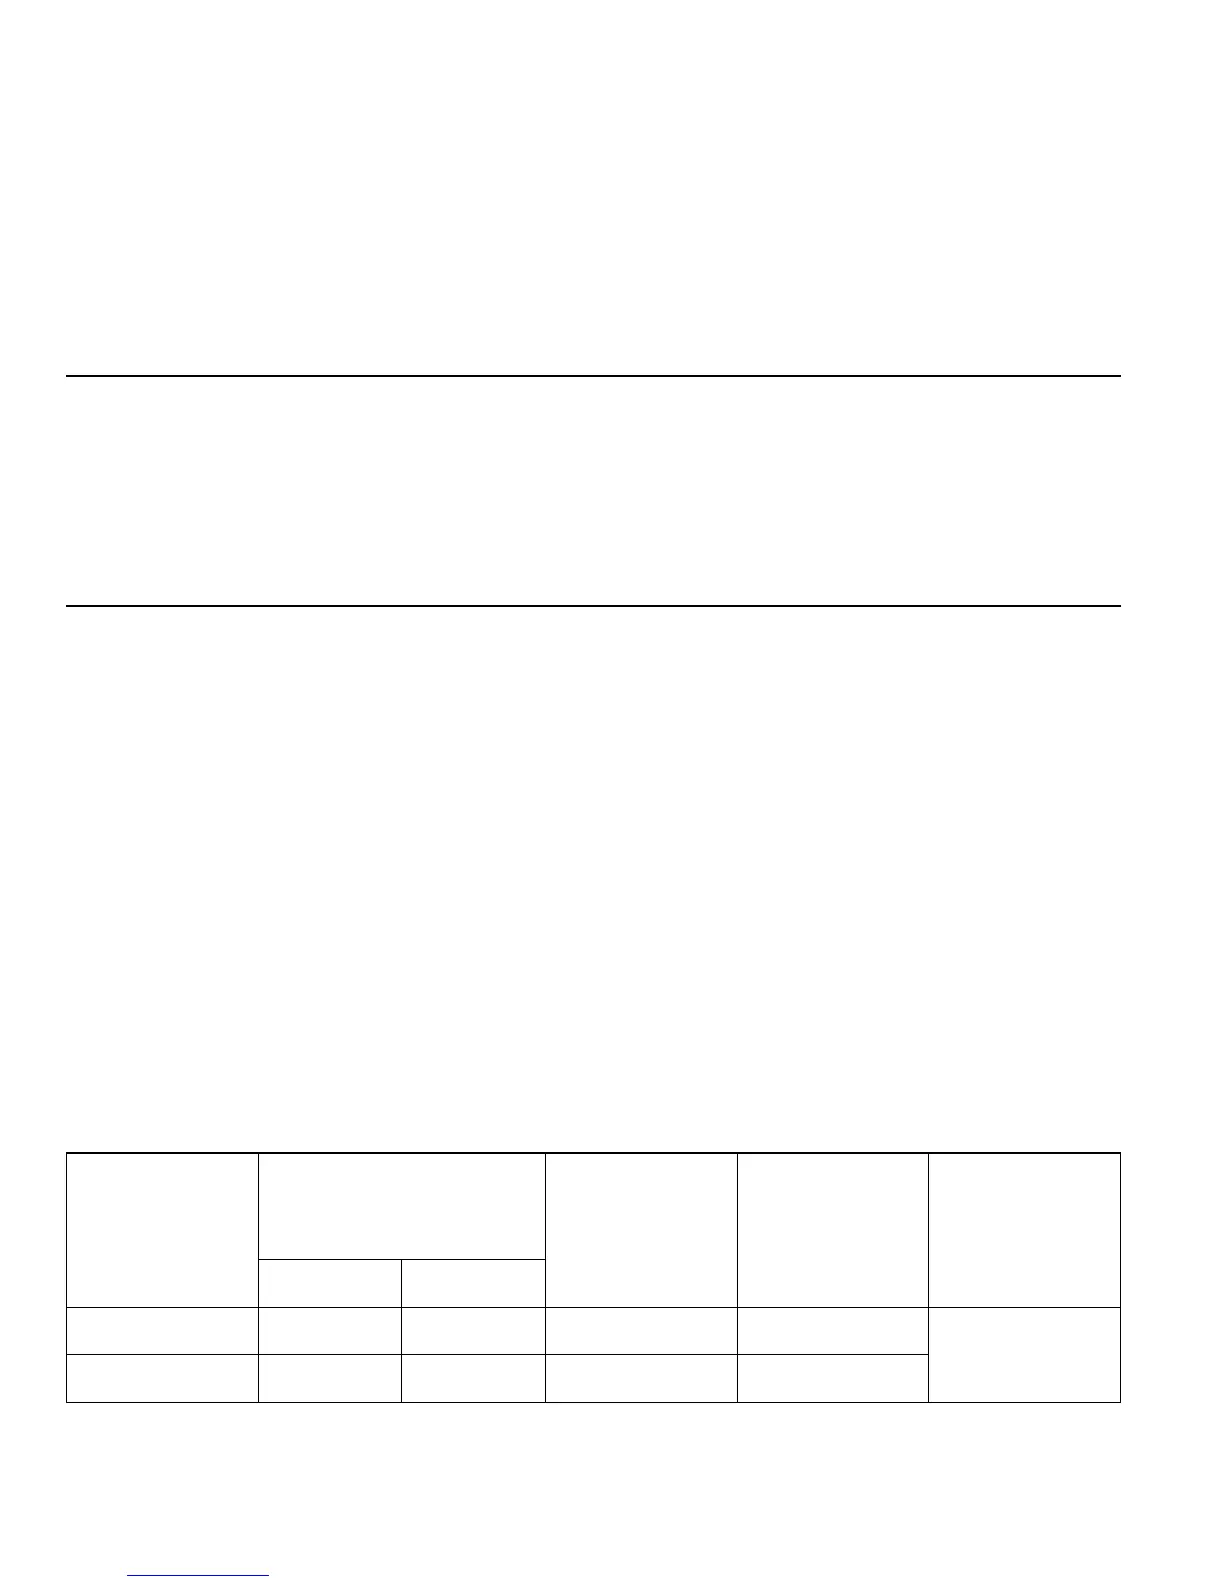
Table 6. Therapy Responders at 12 Months Post-Implant
Responder Responder Rate at
12-Month Follow-Up
Responder Rate at
18-Month Follow-Up
50% Reduction in AHI from
baseline and AHI < 20
66% (83/126) 65% (80/124)
25% Reduction in ODI from
baseline
75% (94/126) 80% (99/124)
Table 7. Randomized Controlled Therapy Withdrawal Study Results in Month 13
AHI Mean AHI
Change
(13M–12M)
Mean
95% CL for
Mean Change
p-value
12-Month 13-Month
Therapy ON 7.2 8.9 1.7 (-1.1, 4.5)
< 0.0001
Therapy OFF 7.6 25.8 18.2 (11.4, 24.9)
 Loading...