5: APPENDICES
58 Iridium Pilot™ Installation Guide
Reading the SST Graphs
The SST output can tell the installer much about the potential RF environment of the ADE’s location during the
test. It should also be noted that two or three scans will add to the knowledge about the RF environment for
slowly changing emissions. Interferers are classied as “in-band” and “out-of-band” and the signature can be
quite dierent.
1. “In-band” interferers may occupy a single channel or several channels clustered together. Since the
frequency band is regulated and only approved for Iridium, in-band interference is frequently a result of
inter-modulation distortion. IMD is caused by two or more interfering signal that combines or “mix” in the
ADE receiver. An example of this would be a transmitter at 1000 MHz combining with a 621 MHz to form
a product frequency at 1621 MHz at the center of the Iridium band. IMD can also be subtraction of two
signals like 1721 MHz minus 100 MHz to achieve 1621 MHz. Other in-band sources can be unintended
emissions from equipment like computers or digital electronics with fast switching speeds. The last potential
for in-band emission is from harmonics of a device transmitting at ½ the Iridium band, 805 to 816 MHz, or
some other frequency that is an integer multiple of the 1616 to 1625.5 MHz band. An example of in-band
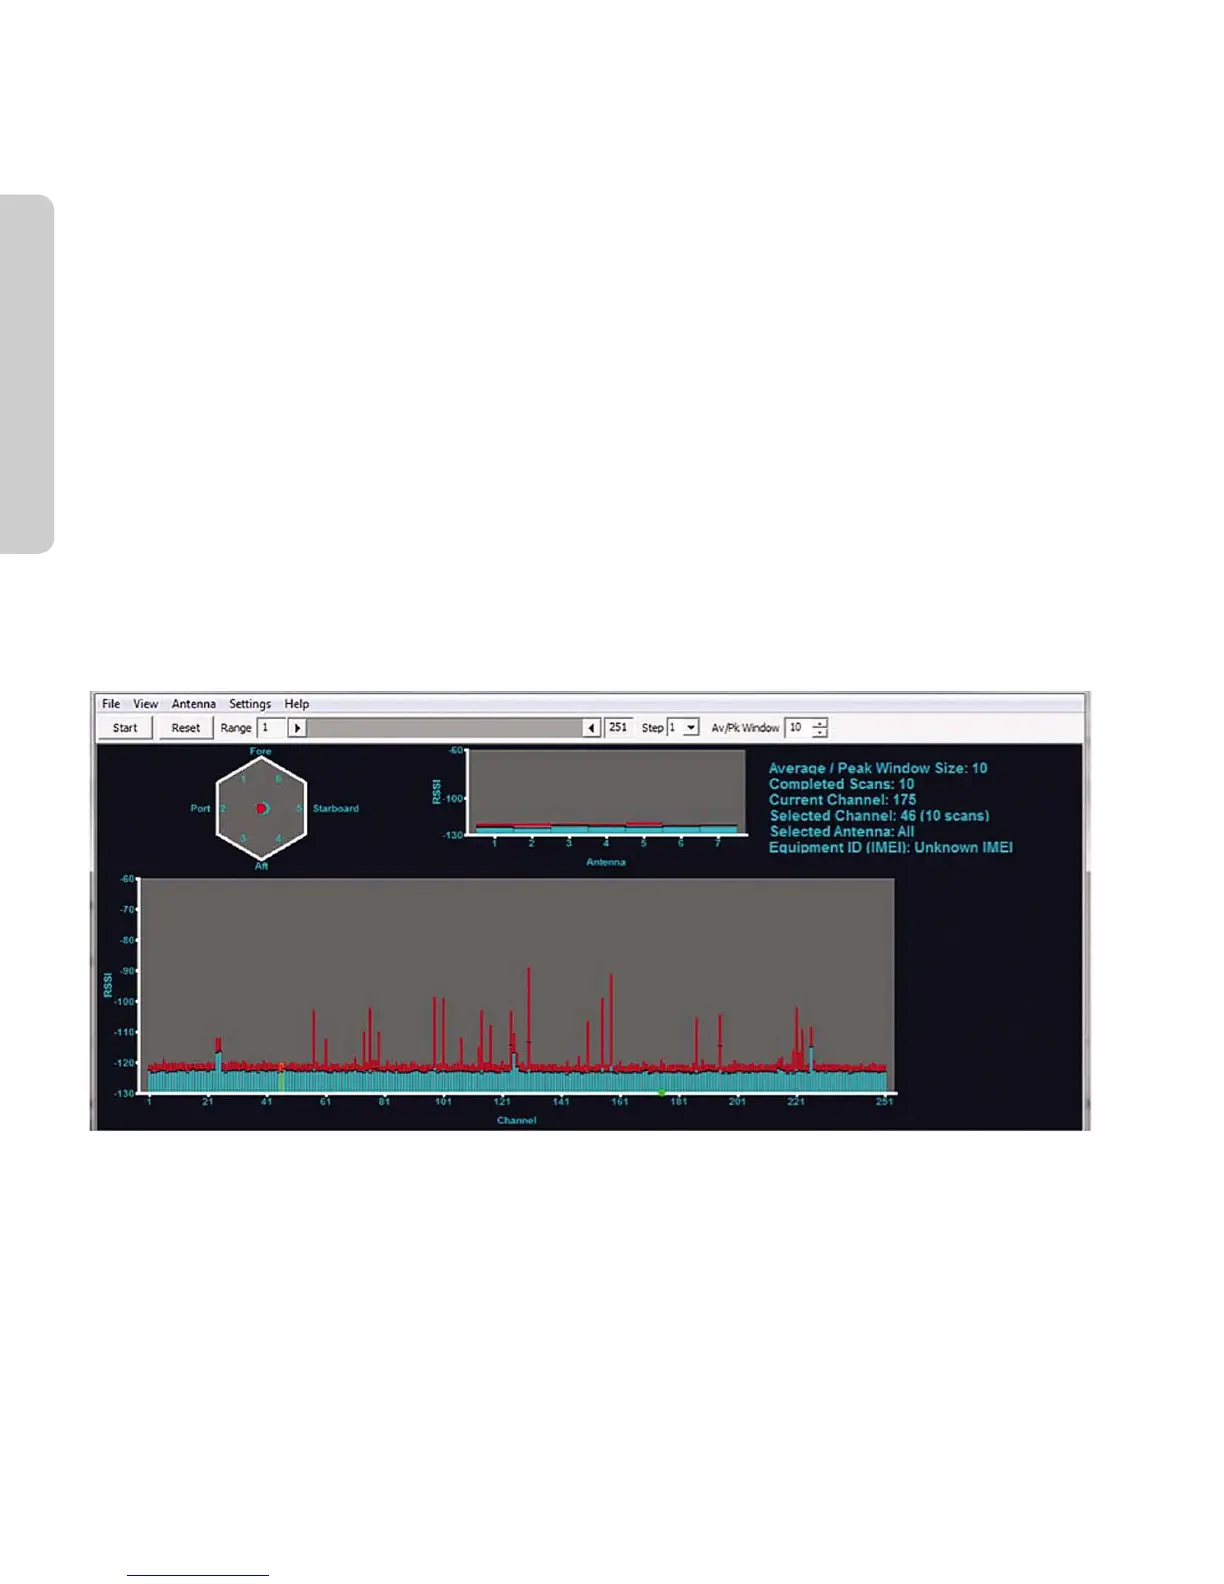
noise can be seen in the graph below. It is caused by the harmonic or the ADE’s internal analog to digital
conversion frequency and appears as slightly elevated “mean” frequencies at channels 24/25, 125 and 226
This becomes apparent in the above plot given that frequencies mentioned above have an elevated “mean”
that has lasted for a signicant portion of the 10 scans. In this case you can expect to see this “self-noise” in
all installations and it does not detract from normal operation.
Figure 20.
2. “Out-of-band” emissions will typically be a single emission close to the iridium band. It is characterized as a
broad-band noise that raises the “noise oor” of the receiver. Typically the noise oor should be below -120
dBm. The example This noise was produced by placing a laptop computer directly on top of the ADE and the
antenna display shows a red peak on the vertical antenna number
3. The center section of the scan was not aected because the computer was not present during the time
these channel were scanned.
4. The next display indicates a very good installation with a minimal noise environment. A 100 scans were
collected (2.7 hours of data) and a few interesting observations can be made.


 To Next Page