5: APPENDICES
Iridium Pilot™ Installation Guide 59
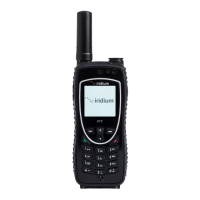
a. First there are three evenly spaced “blue” peaks at the aforementioned channels 24/25, 125 and 226. As
noted above these happen to be “self noise” caused by the harmonic of an internal clock and are expected to
be resent on all installations, but they are a good example of how CW or continuous wave interference will
appear on a multiple scan plot.
b. Second, during this nearly three hour scan no dynamic activity was Iridium band is shared spectrum that we
avoid using during normal operation. There are times during natural disasters when the lower portion of the
band is active, however, so your plot may dier. Dynamic activity is dened as a red peak in excess of -115 dBm
while the mean value remains close to the -123 dBm receiver noise oor on a multi scan plot.
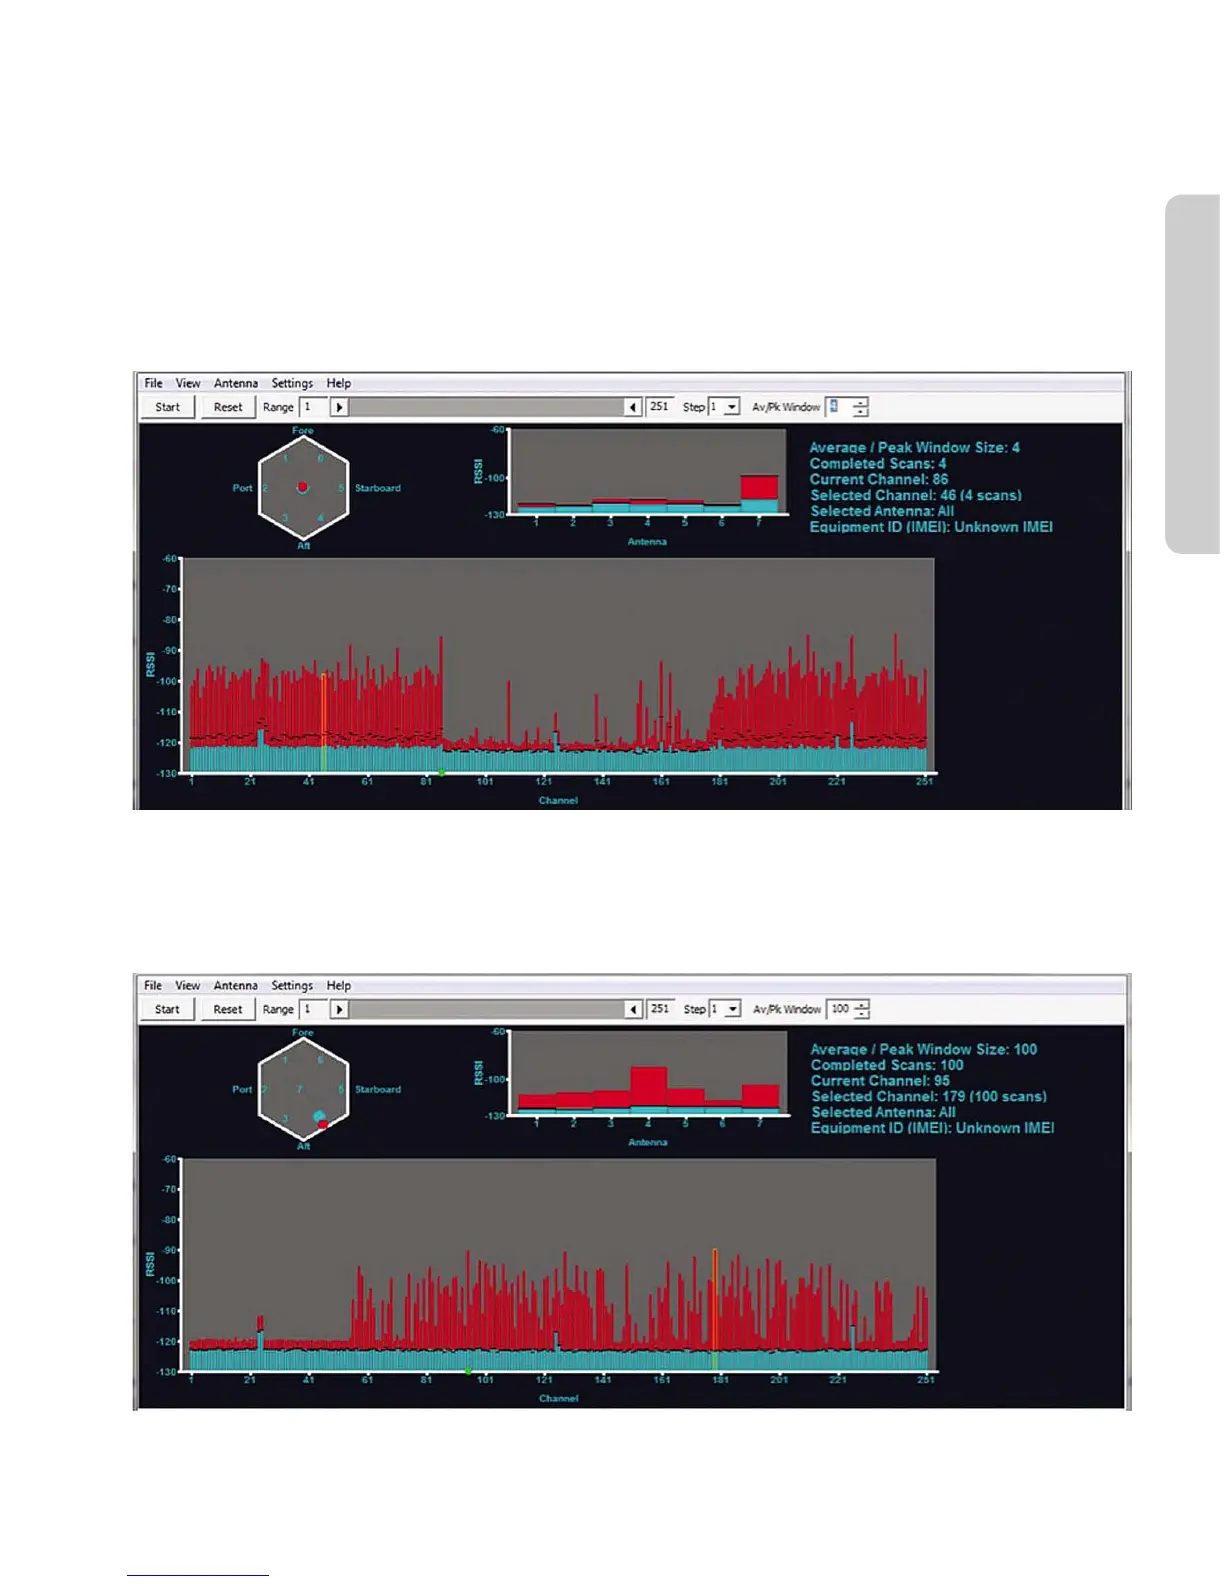
Figure21.
c. Finally, channels 60 thru 251 show a lot of dynamic activity with the peak indication showing considerably
large signals while the mean values hover near -123 dBm. This display is just showing a 2.7 hour history of
active channels the ADE could see and could have used.
Figure 22.


 To Next Page