NOISE GUIDE – MANUAL RETURN TO "TABLE OF CONTENTS"
17
MEASUREMENT DATA
LIVE MEASUREMENT
YoucanviewlivemeasurementsinthesoftwarebyconnectingyourNoiseGuidedirectlytoyourPC.
Alldatawillbesavedautomaticallytothe”NoiseGuideData”folderontheC-driveevery24hours.
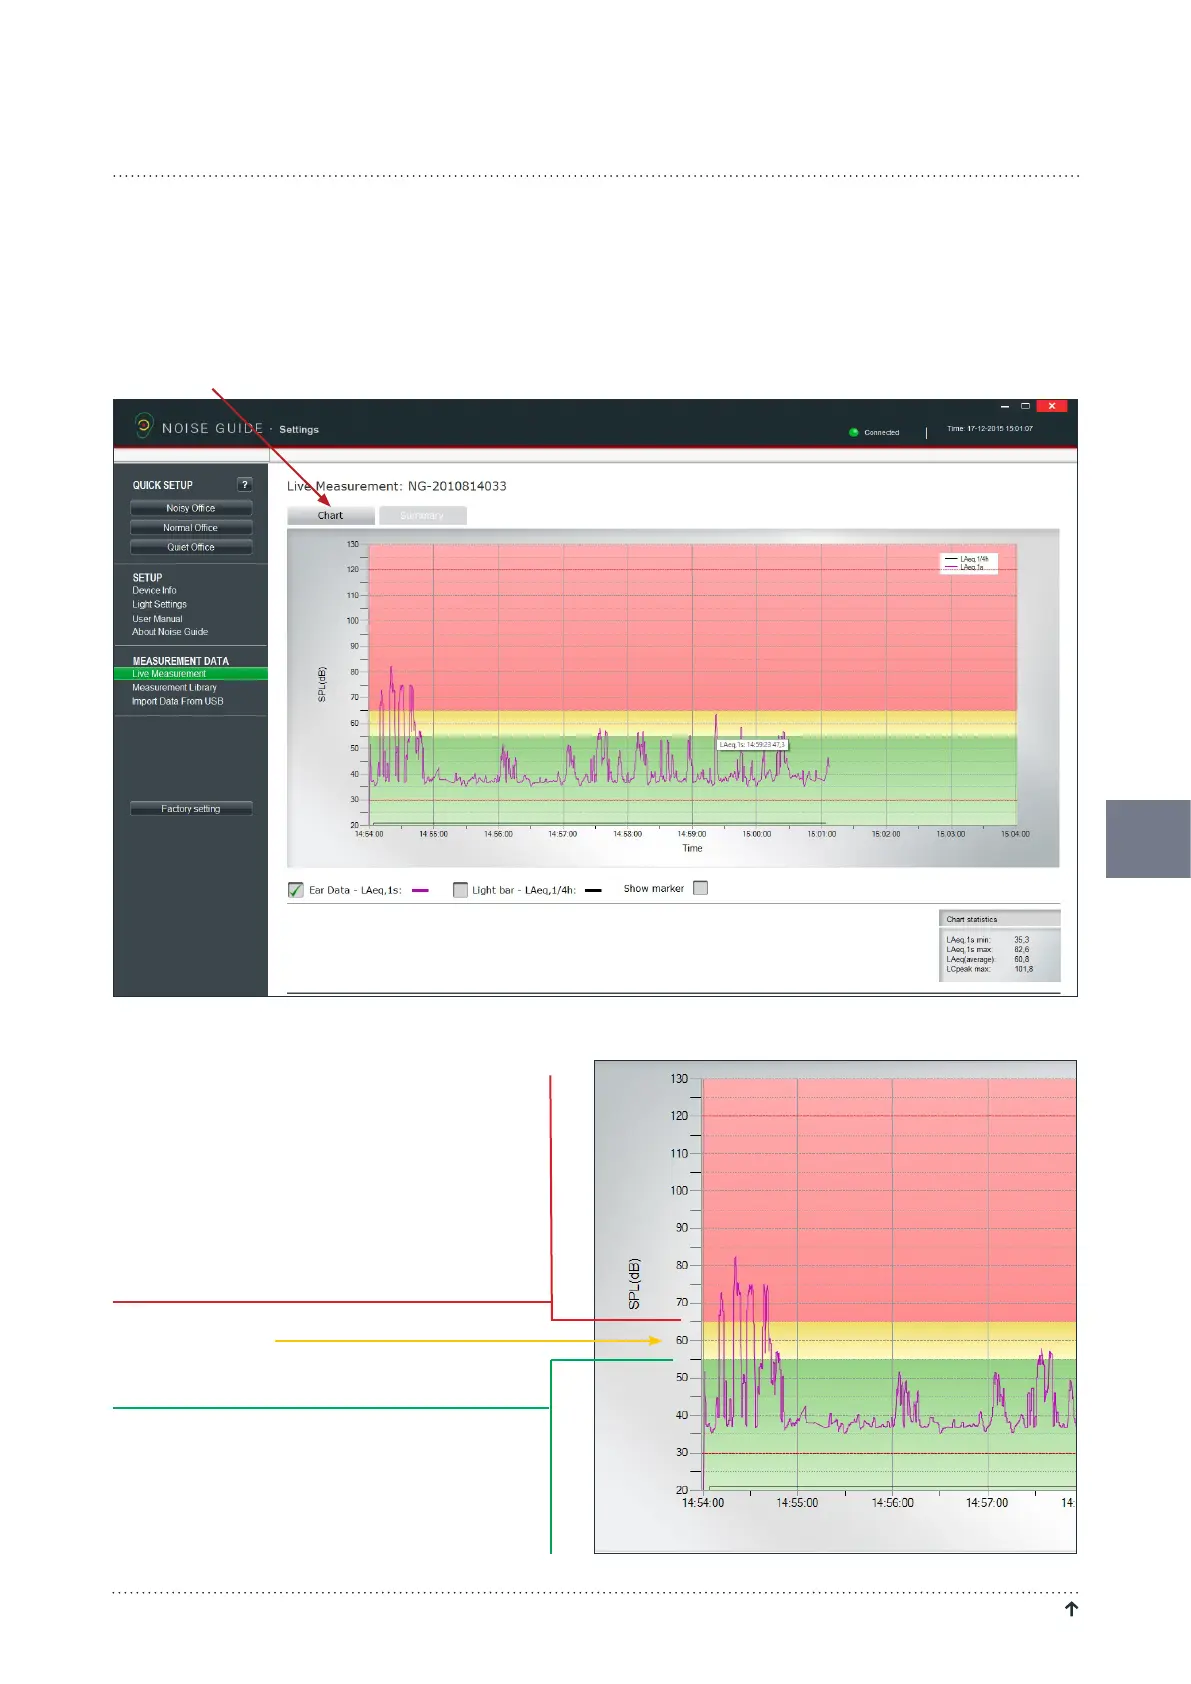
CHART
Under”LiveMeasurement”,selectthelefttab”Chart”toviewlivemeasurementsinagraph.
Thegreen,yellowandredcolourblocksonthegraph
visualizethelightsettingsforyourNoiseGuide.
Thecolourblockswillchangeaccordingtoyourlight
settings.
Example:
Inthisexamplethesettingsare:
Red:65dB-120dB
Yellow:55dB–65dB
Green:30dB–55dB
 Loading...
