NOISE GUIDE – MANUAL RETURN TO "TABLE OF CONTENTS"
19
NAVIGATING THE SOFTWARE
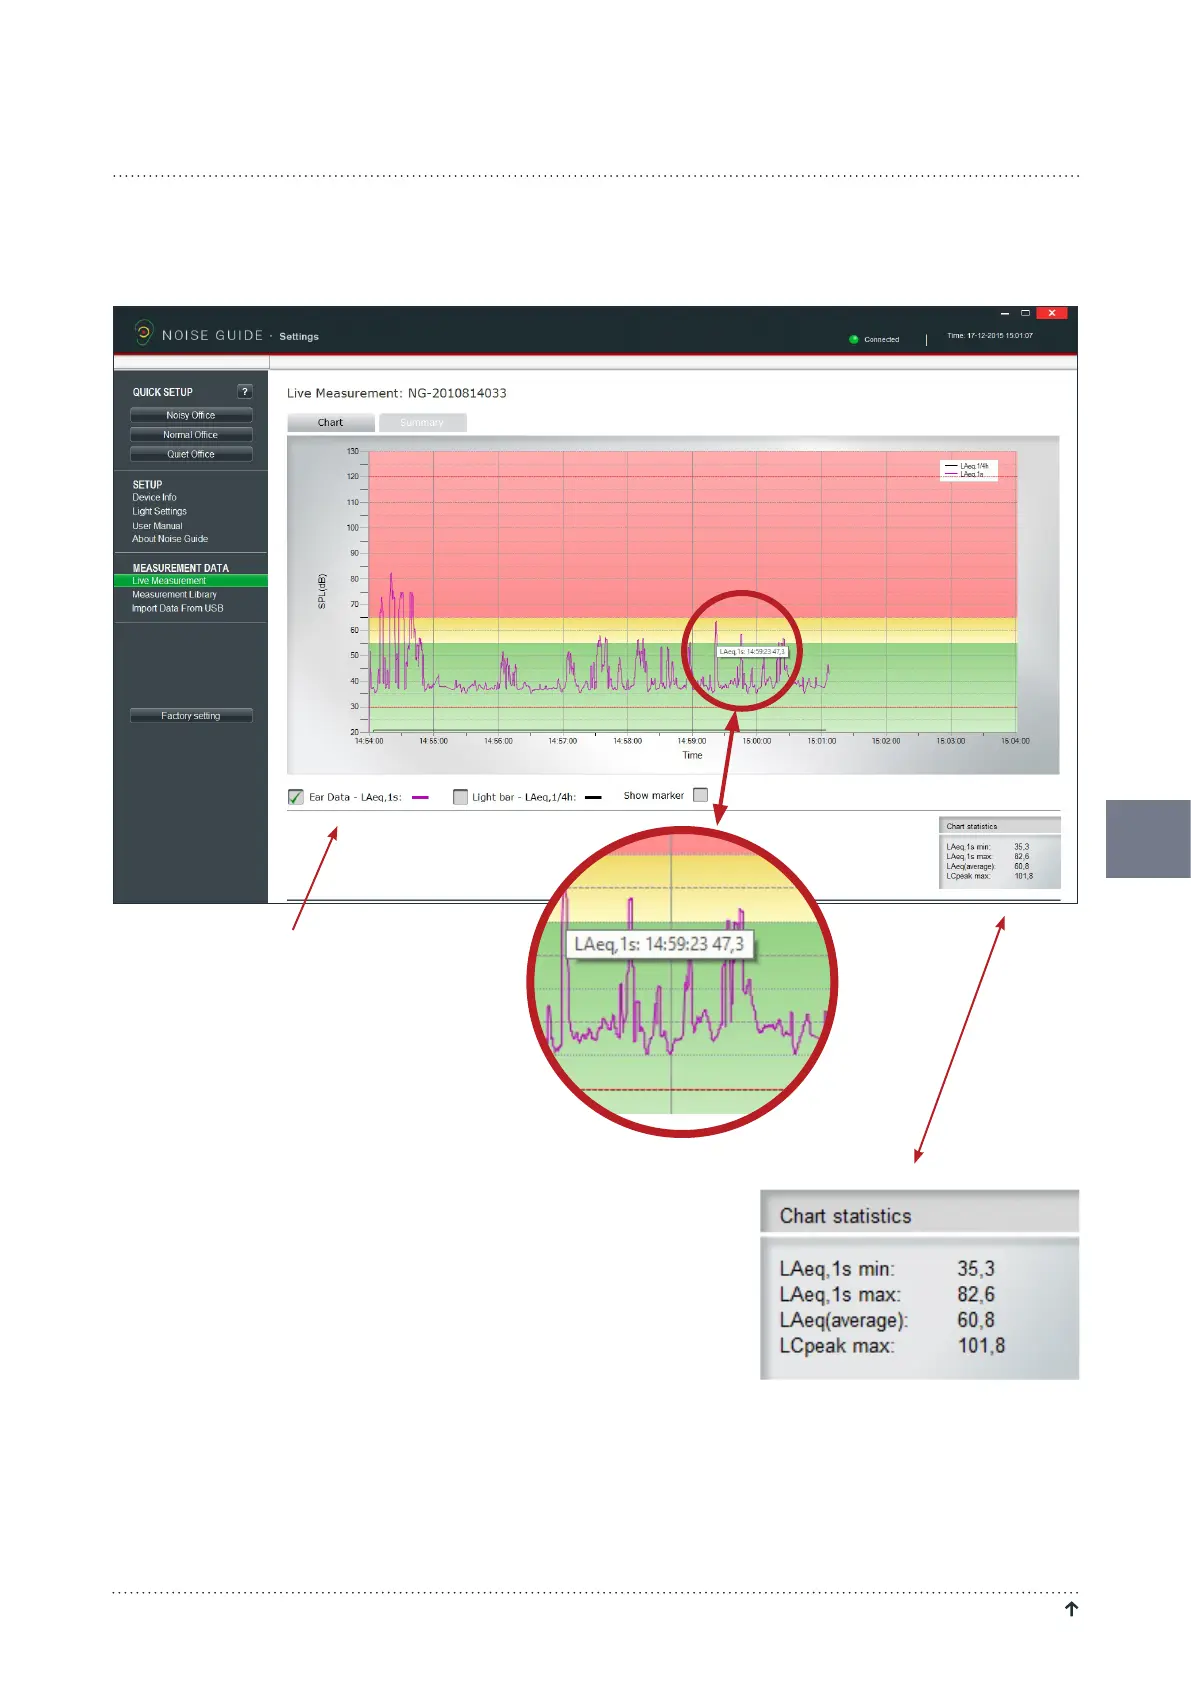
READING THE GRAPH
Placethecursoroverthegraphtoviewtimeandnoiselevelvalues.
Selectwhatvaluesyouwantthegraphtoshow.
In the bottom right corner a box shows the chart statistics
for the certain period.
VALUESEXPLAINED:
LAeq,1smin:Lowestnoisemeasurementforacertainperiod.
LAeq,1smax:Highestmeasurementforacertainperiod.
LAeg(average):Averagenoiselevelforacertainperiod.
LCpeakmax:Highestpeakmeasurementforacertainperiod.
 Loading...
