PhaseStation 53100A User’s Manual V1.04 25-Apr-2022 56
Conversely, TimeLab’s Measurement→Phase difference (Unwrapped) (p) view displays
the TI samples in the form of phase data that’s been “unwrapped.” The sawtooth
discontinuities are removed by adding or subtracting the input signal’s period whenever
the sample-to-sample time difference exceeds half of that period.
It’s seldom necessary to refer to the original phase-difference graph except when
troubleshooting configuration problems with live TI counter measurements. In most
cases you should select the Measurement→Phase difference (Unwrapped) (p) view
when you wish to inspect the principal phase record for your acquisition. Additionally,
all of the flattening, detrending, and data-removal commands on the Edit menu work by
replacing the original phase data with modified data based on the unwrapped record.
After executing any of these commands, the p and u views will always be identical, just
as if the data had been acquired from a frequency counter or direct-digital analyzer.
Further references to the phase-difference view in this manual will appear simply as
Measurement→Phase difference (p), omitting the distinction between wrapped and
original phase data. When working with the PhaseStation and TimePod analyzers, the
original and unwrapped phase difference displays are equivalent.
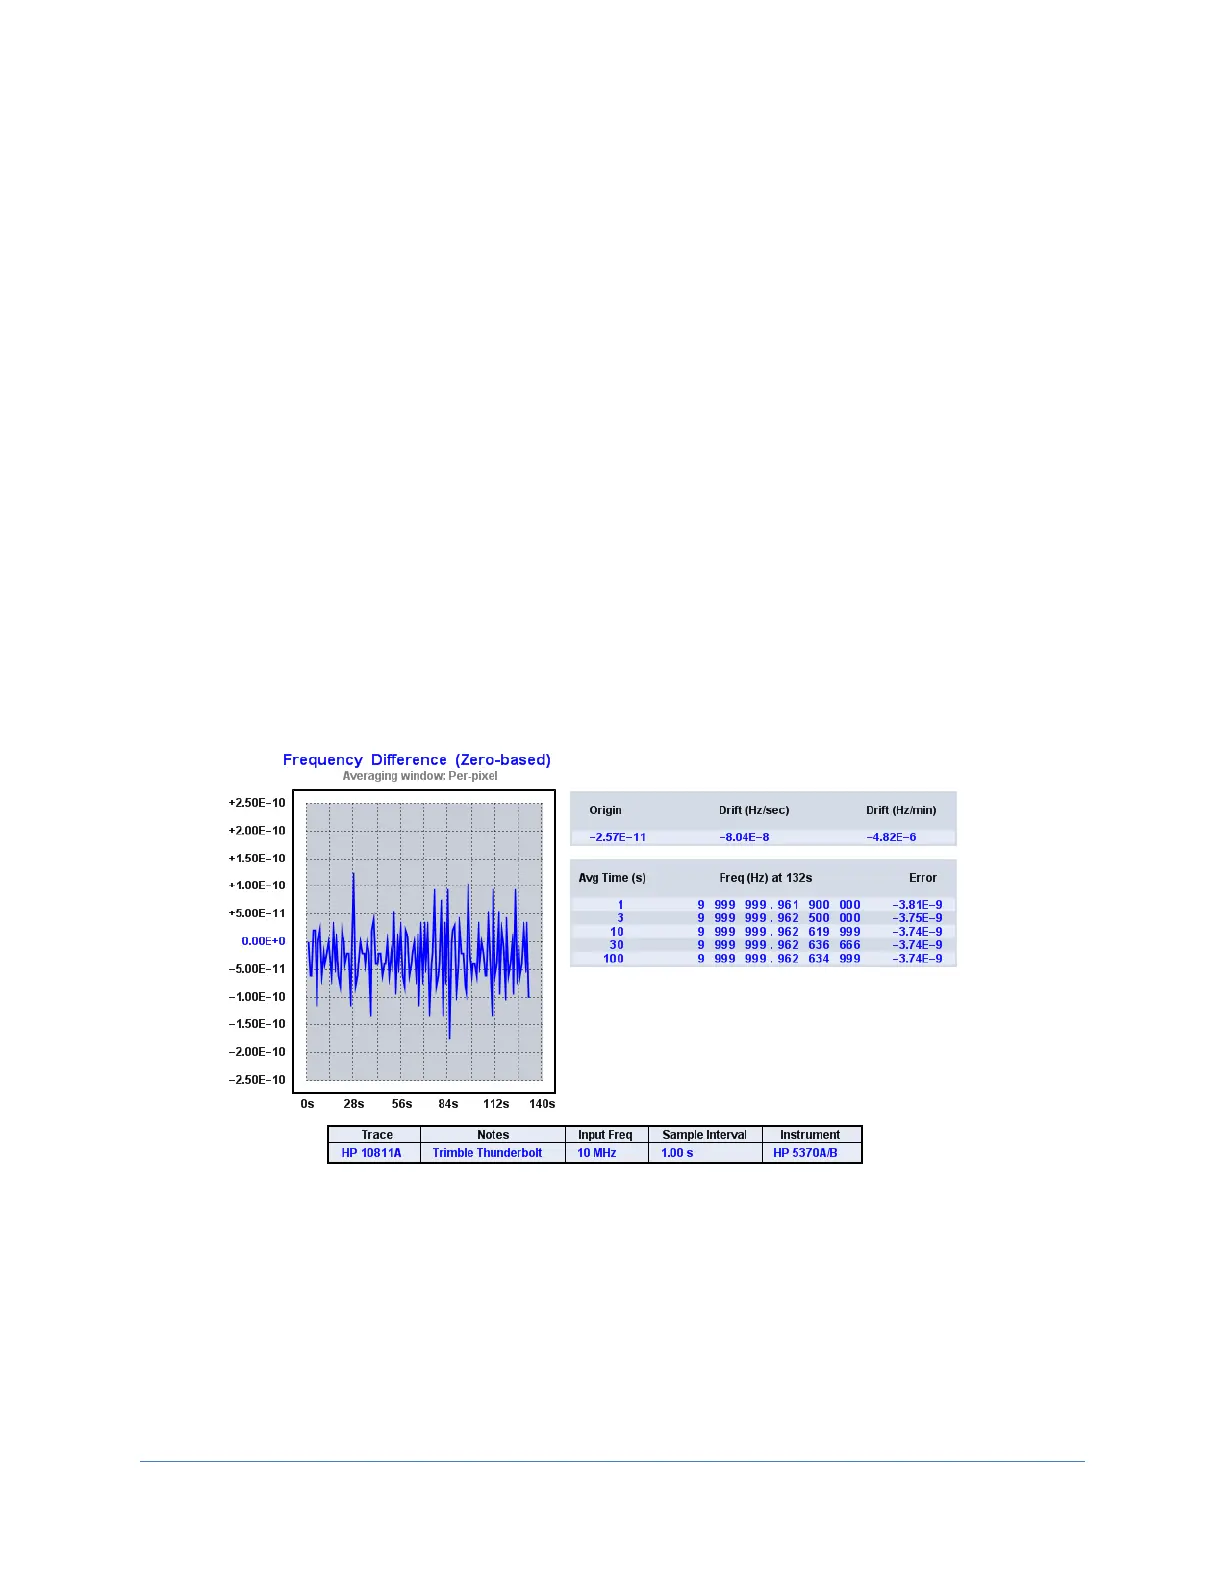
Frequency difference (f)
Shown above is a third way to view the phase data from the earlier example. Each point
on the Measurement→Frequency difference (f) trace is calculated by dividing the
difference between successive pairs of phase-difference samples by the sample rate.
Taking the time derivative of n adjacent phase-difference points in this manner yields a
stream of n-1 frequency-difference points. Because of this differentiation process, the
Measurement→Frequency difference (f) view of the phase record is often better at
Figure 19: Frequency difference measurement view with count chart


 To Next Page